Welcome to the LiveChart Repository
LiveChart is an open-source Android library to draw beautiful yet powerful charts. The library allows for color and data display customization, in an easy to learn, descriptive API.
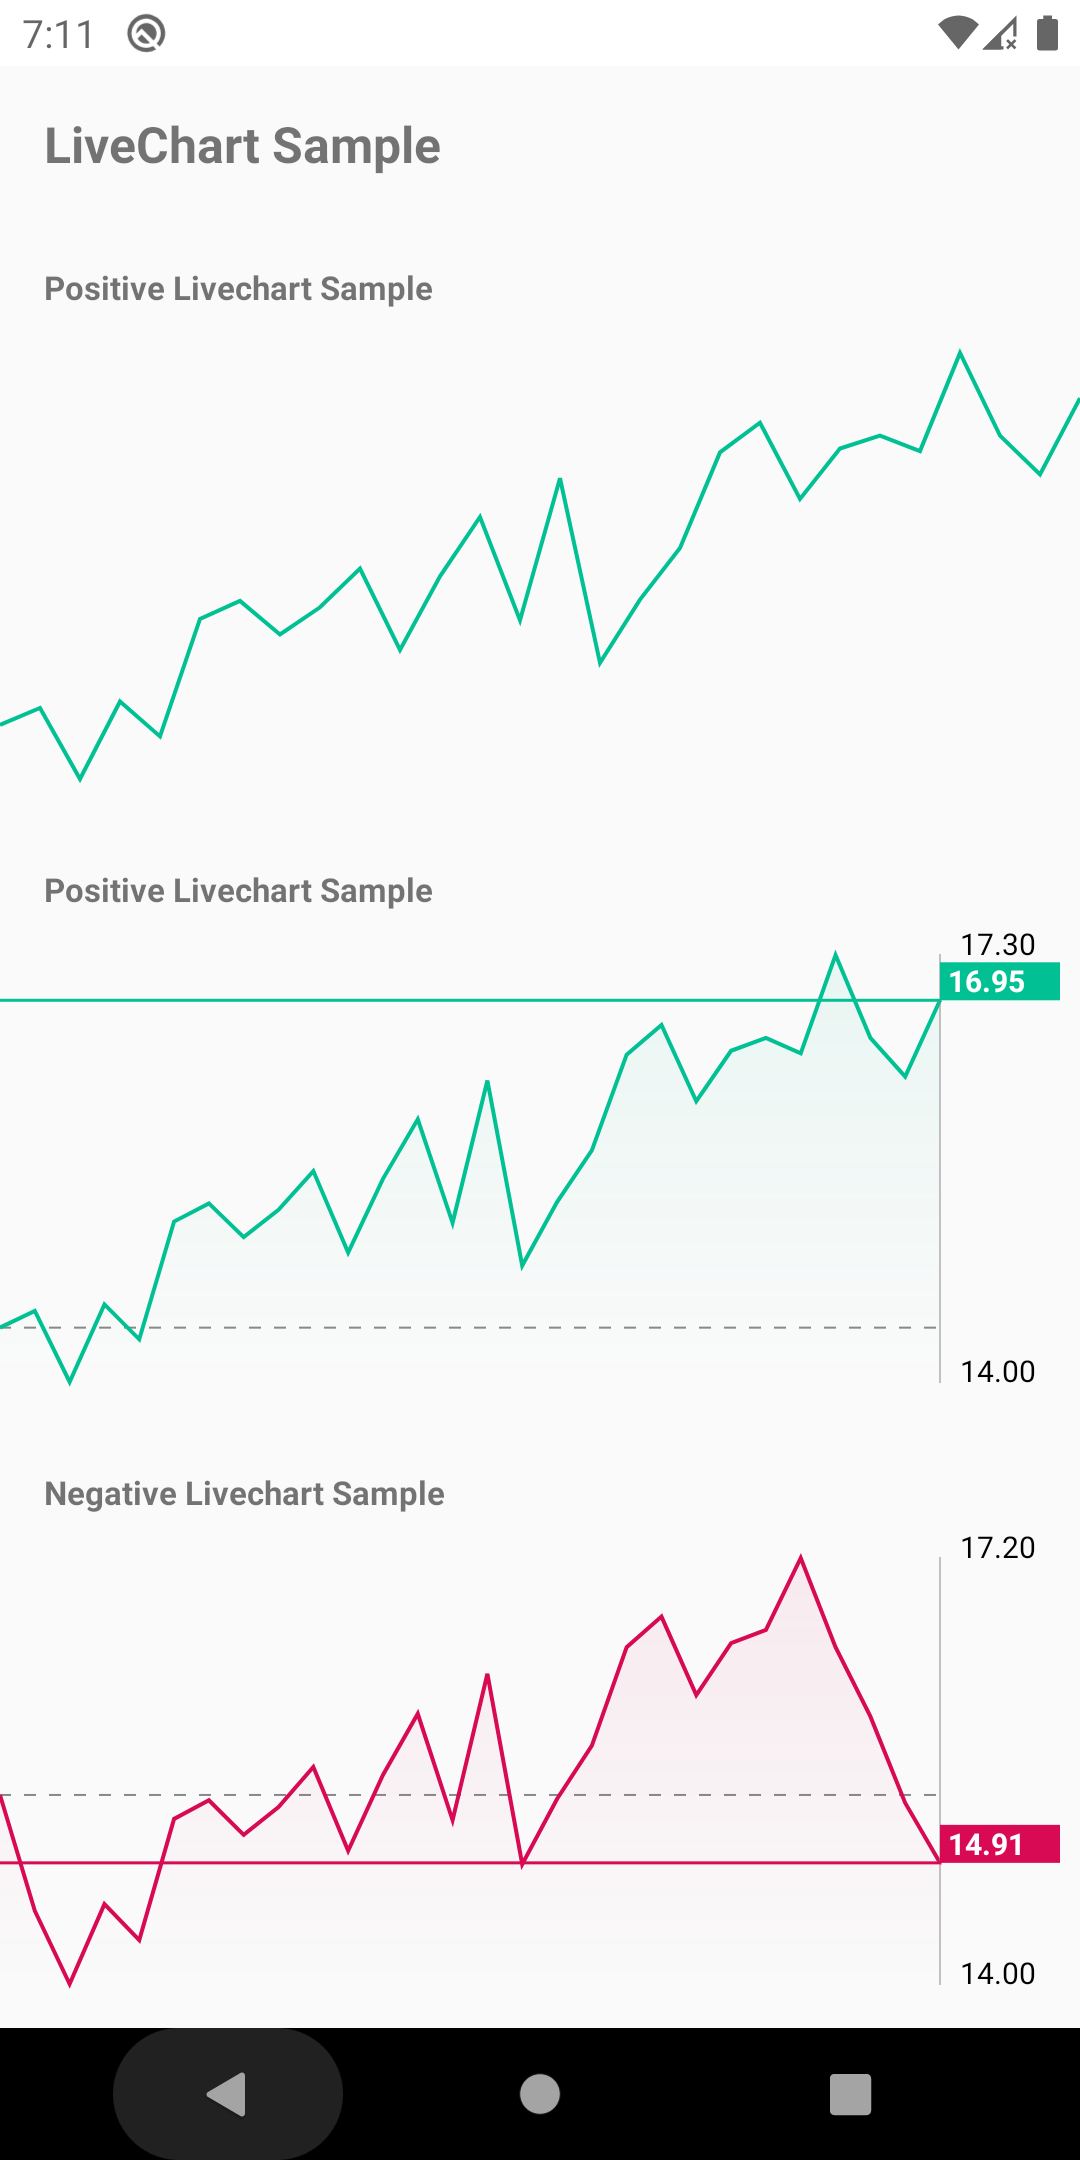
Draw from a simple line to a fully tagged chart with bounds and baseline. The library is perfect (and started out) to draw financial charts where the baseline and color of the chart matters.
Add it to your app
To get LiveChart into your build:
Step 1. Add the JitPack repository to your build file
Add it in your root build.gradle at the end of repositories:
Step 2. Add the dependency
Contributing
Anybody is welcome to contribute! The repository is Commitizen friendly, please refer to their guidelines on commit messages.
Roadmap
The LiveChart library has just started out. Have a look at the roadmap for new features in the horizon. Have a request? Open up an issue with a feature tag.
How to Use
You'll need a reference to a LiveChart view first, either through XML or programmatically:
LiveChart knows how to draw from a Dataset only. Create a new dataset containing a list of DataPoint's:
In order to begin the draw operation, the library uses a chainable, descriptive public API:
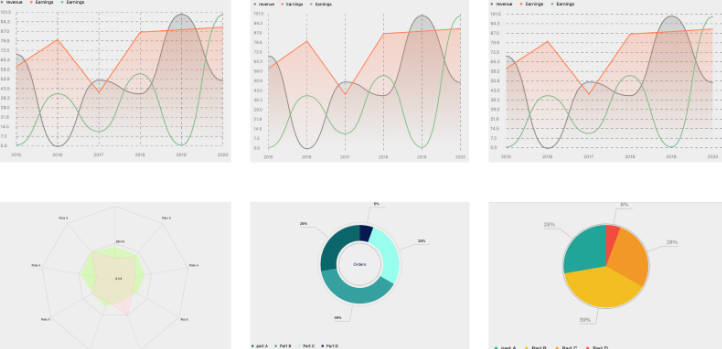
Draw Options
The chart can be as simple as drawing a line on a blank canvas:
Or provide the full set of display capabilities by adding a baseline, a gradient fill and
the axis bounds with data labels:
Refer to the screenshot to view the different options and color change on below baseline/above baseline.
You can find all the possible draw options under the API reference.
Styling
Style Programmatically
Since v1.1.0 LiveChart supports custom styling of almost all its interface
through the LiveChartStyle class. The style object contains all available styling options as
properties you can change:
The above example would result in a rather horrible (yet accurate) view of:

For the full set of attributes available to customise refer to the LiveChartStyle reference.
Any attributes not explicitly set fallback to the LiveChartAttributes object defaults you can view in the
reference too.
Style with XML
You can also style a number of attributes through the XML layout attributes. For example:
For a full set of available attributes you can check the LiveChartView reference.
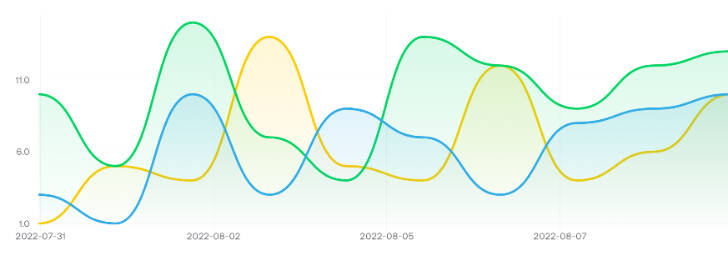
Second Dataset
The library allows for data comparisons by drawing a second dataset on the same chart. The
second dataset defaults to a grey color but you can set the color manually through the style object:
This results in the following chart:

NOTE Want more than two datasets? Don't worry, the project roadmap intends to support drawing
an unlimited number of datasets provided in a list.
Touch Events
Since v1.2.0 LiveChart supports touch events and can draw a visual DataPoint slider that moves with your finger.

The touch overlay is built in to the LiveChart class. You can style the vertical slider and
circle through the LiveChartStyle object or through the XML attributes (See above):
Just drawing the horizontal slider doesn't tell us much though. We can add a listener to get the current
DataPoint of the touch event with the LiveChart.OnTouchCallback:
This allows us to show the current point the user is dragging along.
Disabling the touch overlay
If you don't want the touch overlay it can be disabled easily:
You might want to do this when the chart view is too small to benefit from touch interactions,
or if you require extra optimization in your view drawing and would require as little overhead as
possible.
Things to consider
LiveChart tries to leave a minimal footprint as possible, extending from the built-in Android View
class to perform the draw operations. It follows best practice advice to only perform draw ops
and avoid setting any variables to memory during the onDraw() call.
HOWEVER, drawing big datasets is a costly operation and the Android UI will appear 'janky' if you
are not careful with the amount of data you feed in.
A good Android citizen will only draw the necessary data points, avoid calling drawDataset() repeatedly
and not animate the LiveChartView excessively.
Using LiveChartView only
Even though the main entry point to this library is the LiveChart layout class which contains extra
touch functionality, the base View class LiveChartView that actually performs the drawing is kept
public in case there is performance requirements and you don't need want the touch overlay views
overhead (You can also disable it, see above).
It also allows to override it and add custom functionality to this base class, as LiveChart is kept final.
The View has the exact same public API and xml attributes as the LiveChart class so they are almost
interchangeable.