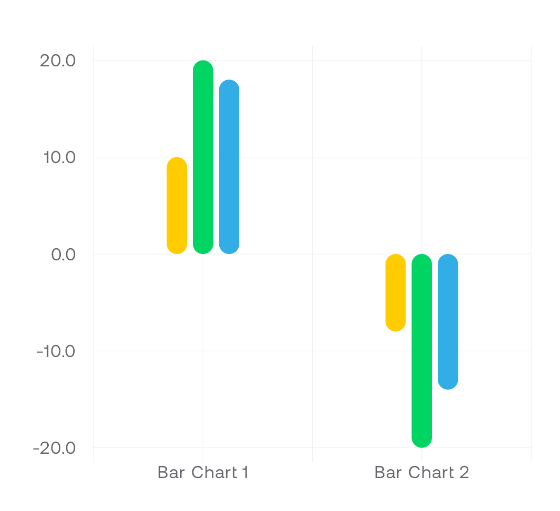
Before using component the BarChartData has to be prepared:
val barChartData = BarChartData(
    categories = listOf(
        BarChartCategory(
            name = "Bar Chart 1",
            entries = listOf(
                BarChartEntry(
                    x = "primary",
                    y = 17f,
                    color = Color.Yellow,
                ),
                BarChartEntry(
                    x = "secondary",
                    y = 30f,
                    color = Color.Red,
                ),
            )
        ),
        BarChartCategory(
            name = "Bar Chart 2",
            entries = listOf(
                BarChartEntry(
                    x = "primary",
                    y = -5f,
                    color = Color.Yellow,
                ),
                BarChartEntry(
                    x = "secondary",
                    y = -24f,
                    color = Color.Red,
                ),
            )
        ),
    )
)
BarChart(
    data = barChartData,
    config = BarChartConfig(
        thickness = 14.dp,
        cornerRadius = 7.dp,
    ),
    modifier = Modifier.height(500.dp),
    animation = ChartAnimation.Sequenced(),
)
There is another component called BarChartWithLegend. It renders bar chart with legend.
BubbleChart
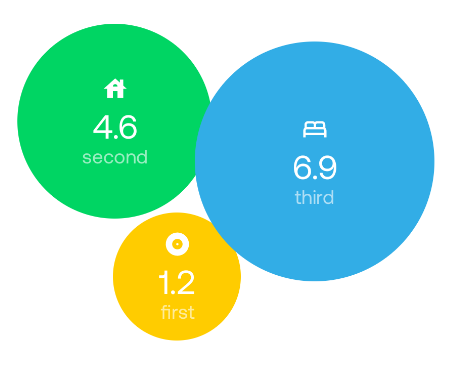
Before using component the list of Bubble has to be prepared:
val bubbles = listOf(
    Bubble(
        name = "first",
        value = 1.2f,
        icon = Icons.Default.Album,
        color = Color.Yellow
    ),
    Bubble(
        name = "second",
        value = 4.6f,
        icon = Icons.Default.House,
        color = Color.Green
    ),
    Bubble(
        name = "third",
        value = 6.9f,
        icon = Icons.Default.Bed,
        color = Color.Blue
    ),
)
BubbleChart(
    bubbles = bubbles,
    modifier = Modifier.size(300.dp),
    animation = ChartAnimation.Sequenced(),
)
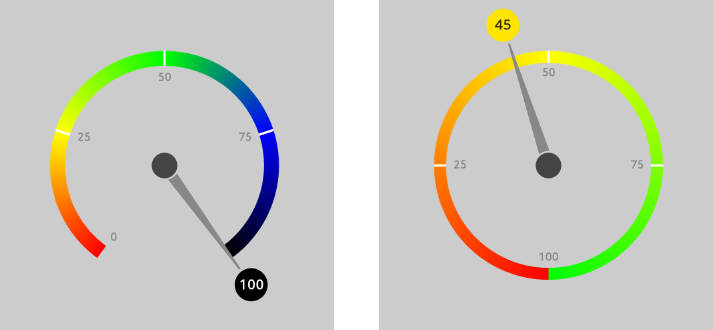
Dial
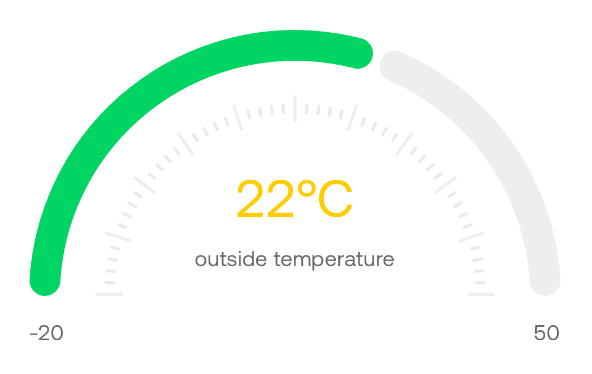
Dial(
    value = 22,
    minValue = -20,
    maxValue = 50,
    modifier = Modifier.fillMaxWidth(),
    animation = ChartAnimation.Simple {
        spring(
            dampingRatio = Spring.DampingRatioMediumBouncy,
            stiffness = Spring.StiffnessLow
        )
    },
    config = DialConfig(
        thickness = 20.dp,
        roundCorners = true,
    ),
    mainLabel = {
        Column(
            horizontalAlignment = Alignment.CenterHorizontally
        ) {
            Text(
                text = "$it°C",
                style = MaterialTheme.typography.h4,
                color = Color.Yellow
            )
            Text(
                text = "outside temperature",
                style = MaterialTheme.typography.body2,
                modifier = Modifier.padding(top = 12.dp)
            )
        }
    }
)
There is another component ProcentageDial. It accepts only one data argument percentage in [0-100] range.
GasBottle

GasBottle(
    percentage = 75f,
    modifier = Modifier.size(width = 200.dp, height = 300.dp),
    animation = ChartAnimation.Simple {
        spring(
            dampingRatio = Spring.DampingRatioMediumBouncy,
            stiffness = Spring.StiffnessVeryLow
        )
    }
)
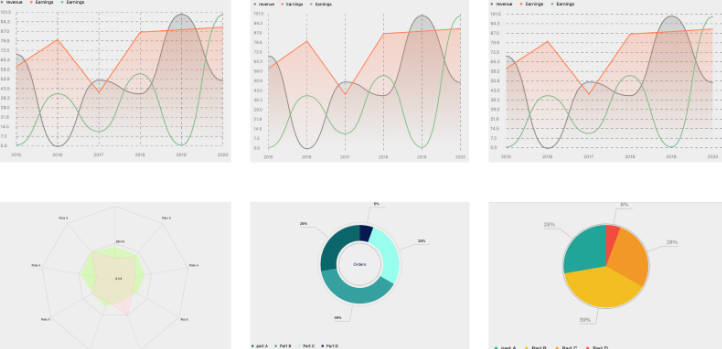
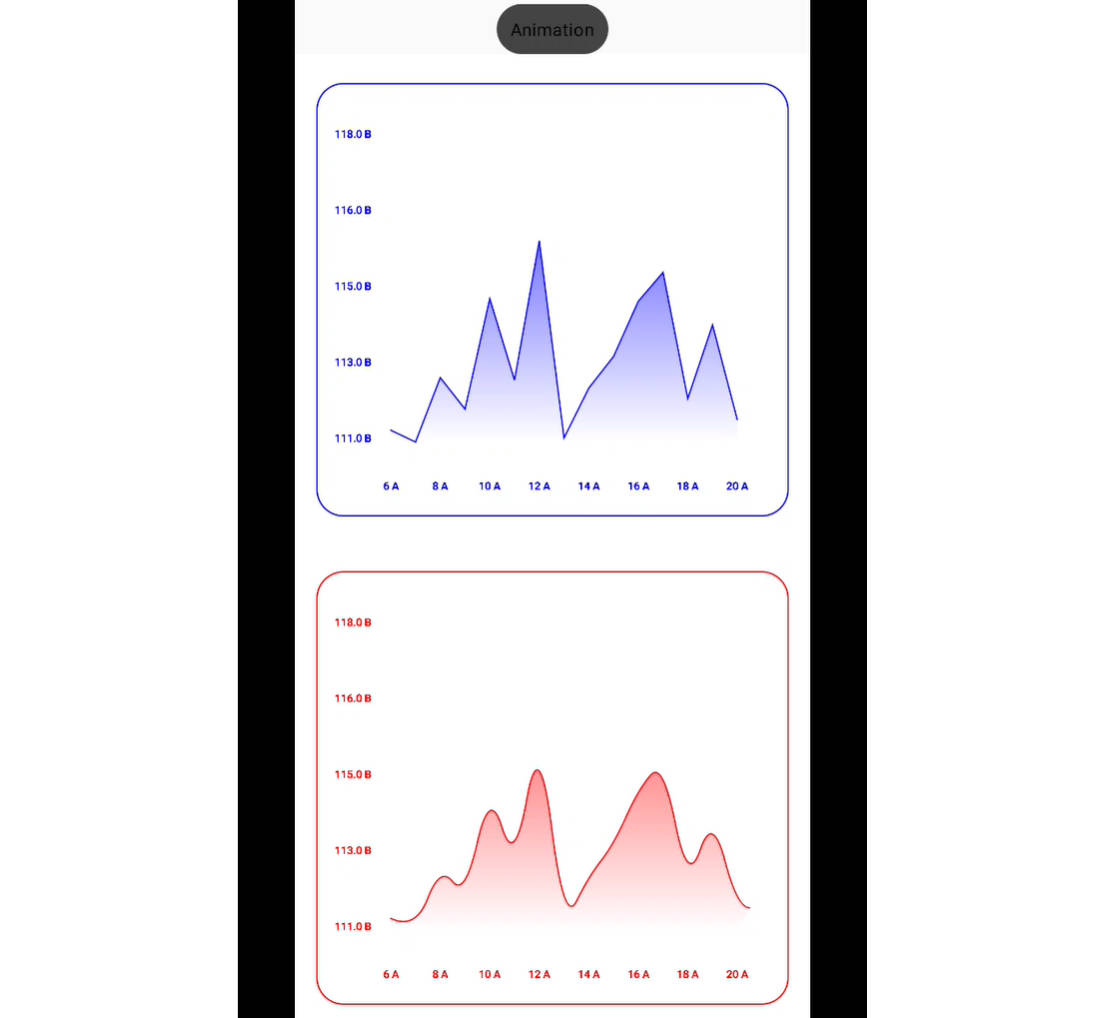
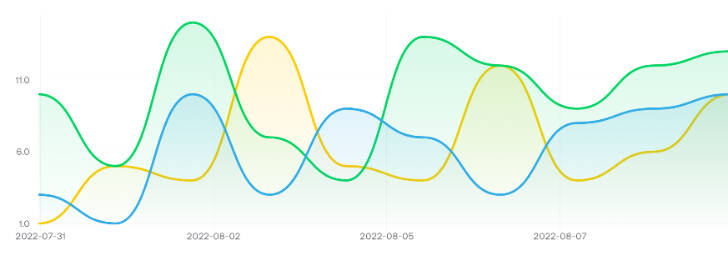
LineChart
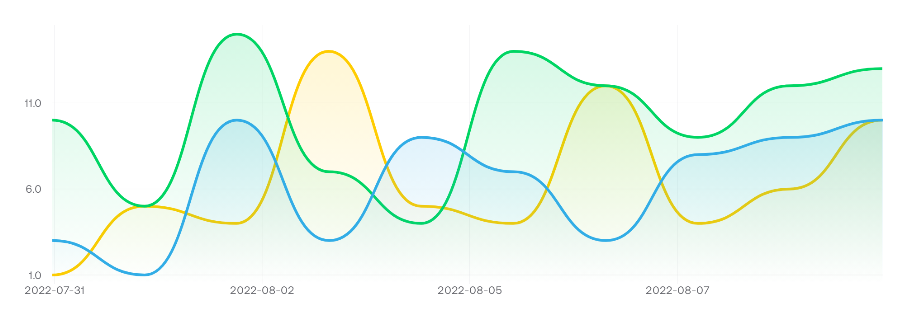
Before using component the LineChartData has to be prepared:
val lineData = remember {
    LineChartData(
        series = (1..3).map {
            LineChartSeries(
                dataName = "data $it",
                lineColor = listOf(
                    Color.Yellow,
                    Color.Red,
                    Color.Blue,
                )[it - 1],
                listOfPoints = (1..10).map { point ->
                    LineChartPoint(
                        x = DateTime.now().minus(TimeSpan(point * 24 * 60 * 60 * 1000.0)).unixMillisLong,
                        y = (1..15).random().toFloat(),
                    )
                }
            )
        },
    )
}
LineChart(
    lineChartData = lineData,
    modifier = Modifier.height(300.dp),
    xAxisLabel = {
        Text(
            fontSize = 12.sp,
            text = DateTime.fromUnix(it as Long).format("yyyy-MM-dd"),
            textAlign = TextAlign.Center
        )
    },
    overlayHeaderLabel = {
        Text(
            text = DateTime.fromUnix(it as Long).format("yyyy-MM-dd"),
            style = MaterialTheme.typography.overline
        )
    },
    animation = ChartAnimation.Sequenced()
)
PieChart
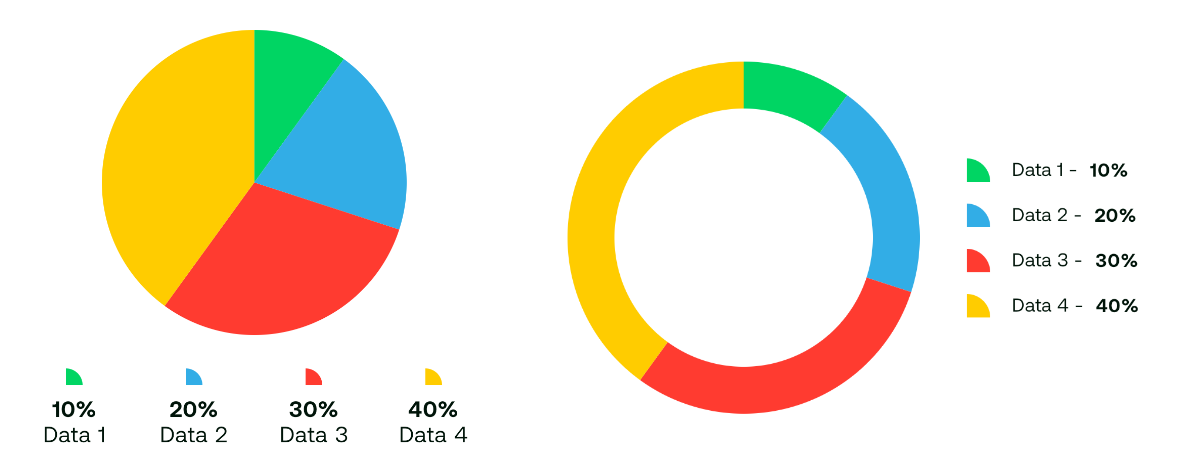
Before using component the list of PieChartData has to be prepared:
val data = listOf(
    PieChartData(
        name = "Data 1",
        value = 10.0,
        color = Color.Yellow,
    ),
    PieChartData(
        name = "Data 2",
        value = 20.0,
        color = Color.Green,
    ),
    PieChartData(
        name = "Data 3",
        value = 30.0,
        color = Color.Blue,
    ),
    PieChartData(
        name = "Data 4",
        value = 40.0,
        color = Color.Red,
    )
)
PieChart(
    data = data,
    modifier = Modifier.size(300.dp),
    config = PieChartConfig(
        thickness = 40.dp
    ),
)
By default the thickness is Dp.Infinity, it means the chart will be fully filled.
Theming
The easiest way to set the same colors for all charts is to provide ChartColors in the app theme.
private val chartColors = ChartColors(
    primary = Color.Green,
    grid = Color.LightGray,
    surface = Color.White,
    fullGasBottle = Color.Green,
    emptyGasBottle = Color.Red,
    overlayLine = Color.Magenta
)

@Composable
fun AppTheme(
    darkTheme: Boolean = isSystemInDarkTheme(),
    content: @Composable () -> Unit,
) {
    CompositionLocalProvider(
        // ...
        LocalChartColors provides chartColors,
    ) {
        MaterialTheme(
            // ...
            content = content,
        )
    }
}
There is also default ChartColors provided by the library. It uses the default color set from MaterialTheme.
LocalChartColors provides ChartDefaults.chartColors()
Each chart has its own color set which can be used like:
BarChart(
    data = barChartData,
    colors = BarChartColors(grid = Color.LightGray)
)
Also there is possibility to use ChartColors inside the specific chart:
BarChart(
    data = barChartData,
    colors = ChartColors(...).barChartColors,
)
Contributing
Feel free to create a PR.
License
This library is available as open source under the terms of the MIT License.