AAY-chart
Library contains several chart composables for usage in Kotlin Multiplatform projects.
Currently supported platforms are Desktop and Android.
Brought with ❤️ by: Jewel Team ?

How to use?
Add dependency in your module build.gradle
dependencies {
    implementation ""

    implementation project(':charts')
    implementation()
}
Examples
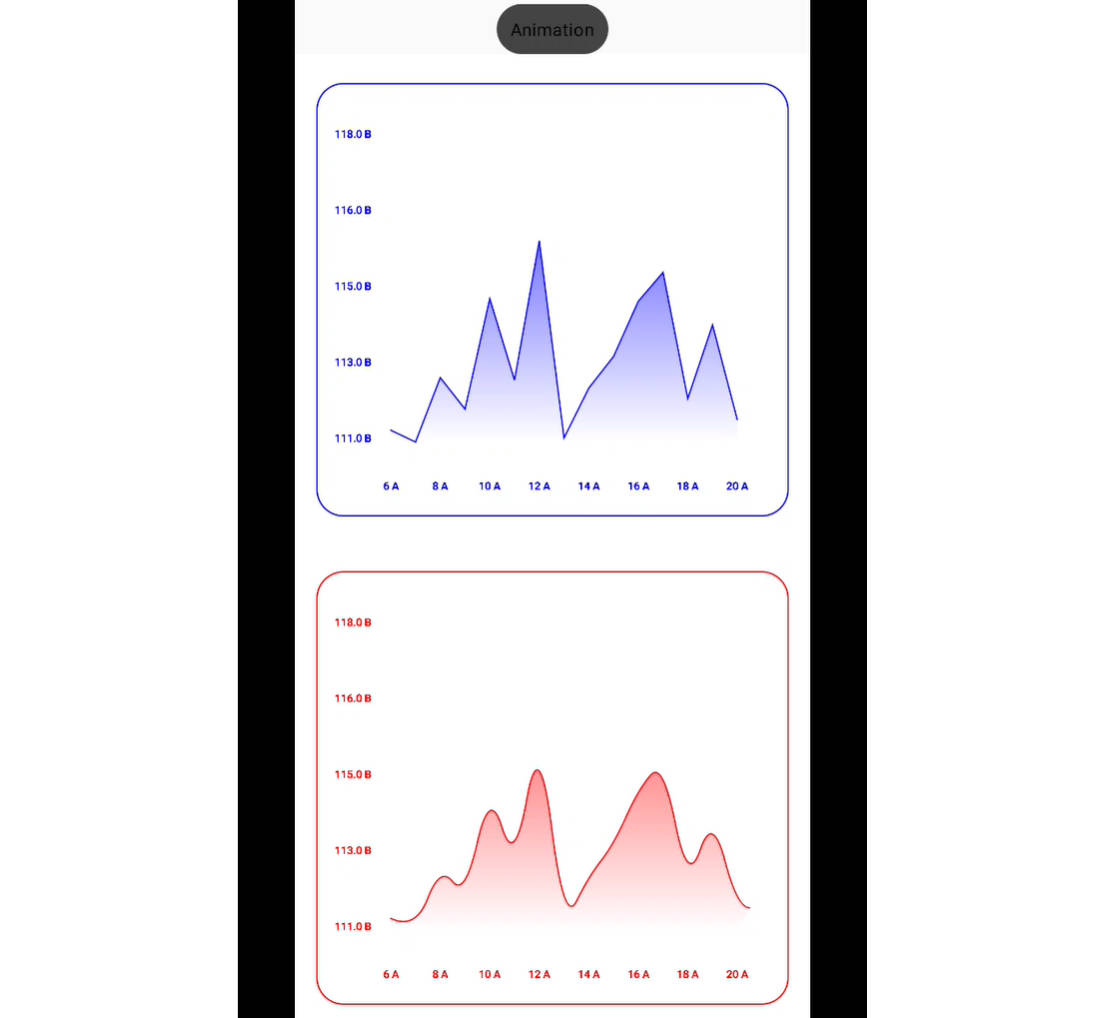
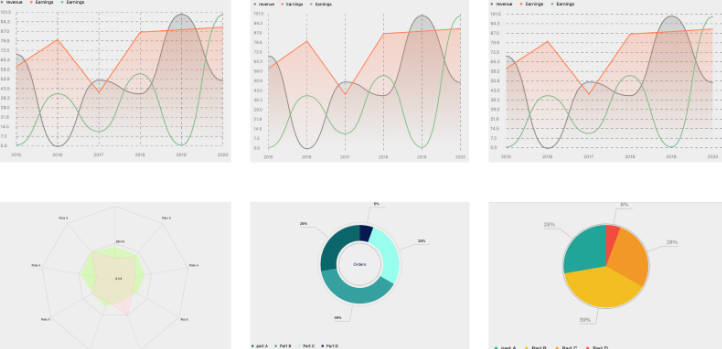
- Show Line Chart in Jetpack Compose:
@Composable
fun LineChartSample() {

    val testLineParameters: List<LineParameters> = listOf(
        LineParameters(
            label = "revenue",
            data = listOf(70.0, 00.0, 50.33, 40.0, 100.500, 50.0),
            lineColor = Color.Gray,
            lineType = LineType.CURVED_LINE,
            lineShadow = true,
        ),
        LineParameters(
            label = "Earnings",
            data = listOf(60.0, 80.6, 40.33, 86.232, 88.0, 90.0),
            lineColor = Color(0xFFFF7F50),
            lineType = LineType.DEFAULT_LINE,
            lineShadow = true
        ),
        LineParameters(
            label = "Earnings",
            data = listOf(1.0, 40.0, 11.33, 55.23, 1.0, 100.0),
            lineColor = Color(0xFF81BE88),
            lineType = LineType.CURVED_LINE,
            lineShadow = false,
        )
    )

    Box(Modifier) {
        LineChart(
            modifier = Modifier.fillMaxSize(),
            linesParameters = testLineParameters,
            isGrid = true,
            gridColor = Color.Blue,
            xAxisData = listOf("2015", "2016", "2017", "2018", "2019", "2020"),
            animateChart = true,
            showGridWithSpacer = true,
            yAxisStyle = TextStyle(
                fontSize = 14.sp,
                color = Color.Gray,
            ),
            xAxisStyle = TextStyle(
                fontSize = 14.sp,
                color = Color.Gray,
                fontWeight = FontWeight.W400
            ),
            yAxisRange = 14,
            oneLineChart = false,
            gridOrientation = GridOrientation.VERTICAL
        )
    }
}


- Show Bar Chart in Jetpack Compose:
@Composable
fun BarChartSample() {

    val testBarParameters: List<BarParameters> = listOf(
        BarParameters(
            dataName = "Completed",
            data = listOf(0.6, 10.6, 80.0, 50.6, 44.0, 100.6, 10.0),
            barColor = Color(0xFF6C3428)
        ),
        BarParameters(
            dataName = "Completed",
            data = listOf(50.0, 30.6, 77.0, 69.6, 50.0, 30.6, 80.0),
            barColor = Color(0xFFBA704F),
        ),
        BarParameters(
            dataName = "Completed",
            data = listOf(100.0, 99.6, 60.0, 80.6, 10.0, 100.6, 55.99),
            barColor = Color(0xFFDFA878),
        ),
    )

    Box(Modifier.fillMaxSize()) {
        BarChart(
            chartParameters = testBarParameters,
            gridColor = Color.DarkGray,
            xAxisData = listOf("2016", "2017", "2018", "2019", "2020", "2021", "2022"),
            isShowGrid = true,
            animateChart = true,
            showGridWithSpacer = true,
            yAxisStyle = TextStyle(
                fontSize = 14.sp,
                color = Color.DarkGray,
            ),
            xAxisStyle = TextStyle(
                fontSize = 14.sp,
                color = Color.DarkGray,
                fontWeight = FontWeight.W400
            ),
            yAxisRange = 15,
            barWidth = 20.dp
        )
    }
}

- Show Pie Chart in Jetpack Compose:
@Composable
fun PieChartSample() {

    val testPieChartData: List<PieChartData> = listOf(
        PieChartData(
            partName = "part A",
            data = 500.0,
            color = Color(0xFF22A699),
        ),
        PieChartData(
            partName = "Part B",
            data = 700.0,
            color = Color(0xFFF2BE22),
        ),
        PieChartData(
            partName = "Part C",
            data = 500.0,
            color = Color(0xFFF29727),
        ),
        PieChartData(
            partName = "Part D",
            data = 100.0,
            color = Color(0xFFF24C3D),
        ),
    )

    PieChart(
        modifier = Modifier.fillMaxSize(),
        pieChartData = testPieChartData,
        ratioLineColor = Color.LightGray,
        textRatioStyle = TextStyle(color = Color.Gray),
    )
}

- Show Donut Chart in Jetpack Compose:
@Composable
fun DonutChartSample() {

    val testPieChartData: List<PieChartData> = listOf(
        PieChartData(
            partName = "part A",
            data = 500.0,
            color = Color(0xFF0B666A),
        ),
        PieChartData(
            partName = "Part B",
            data = 700.0,
            color = Color(0xFF35A29F),
        ),
        PieChartData(
            partName = "Part C",
            data = 500.0,
            color = Color(0xFF97FEED),
        ),
        PieChartData(
            partName = "Part D",
            data = 100.0,
            color = Color(0xFF071952),
        ),
    )

    DonutChart(
        modifier = Modifier.fillMaxSize(),
        pieChartData = testPieChartData,
        centerTitle = "Orders",
        centerTitleStyle = TextStyle(color = Color(0xFF071952)),
        outerCircularColor = Color.LightGray,
        innerCircularColor = Color.Gray,
        ratioLineColor = Color.LightGray,
    )
}

- Show Radar Chart in Jetpack Compose:
@Composable
fun RadarChartSample() {
    val radarLabels =
        listOf(
            "Party A",
            "Party A",
            "Party A",
            "Part A",
            "Party A",
            "Party A",
            "Party A",
            "Party A",
            "Party A"
        )
    val values2 = listOf(120.0, 160.0, 110.0, 112.0, 200.0, 120.0, 145.0, 101.0, 200.0)
    val values = listOf(180.0, 180.0, 165.0, 135.0, 120.0, 150.0, 140.0, 190.0, 200.0)
    val labelsStyle = TextStyle(
        color = Color.Black,
        fontFamily = FontFamily.Serif,
        fontWeight = FontWeight.Medium,
        fontSize = 10.sp
    )

    val scalarValuesStyle = TextStyle(
        color = Color.Black,
        fontFamily = FontFamily.Serif,
        fontWeight = FontWeight.Medium,
        fontSize = 10.sp
    )

    RadarChart(
        modifier = Modifier.fillMaxSize(),
        radarLabels = radarLabels,
        labelsStyle = labelsStyle,
        netLinesStyle = NetLinesStyle(
            netLineColor = Color(0x90ffD3CFD3),
            netLinesStrokeWidth = 2f,
            netLinesStrokeCap = StrokeCap.Butt
        ),
        scalarSteps = 2,
        scalarValue = 200.0,
        scalarValuesStyle = scalarValuesStyle,
        polygons = listOf(
            Polygon(
                values = values,
                unit = "$",
                style = PolygonStyle(
                    fillColor = Color(0xffc2ff86),
                    fillColorAlpha = 0.5f,
                    borderColor = Color(0xffe6ffd6),
                    borderColorAlpha = 0.5f,
                    borderStrokeWidth = 2f,
                    borderStrokeCap = StrokeCap.Butt,
                )
            ),
            Polygon(
                values = values2,
                unit = "$",
                style = PolygonStyle(
                    fillColor = Color(0xffFFDBDE),
                    fillColorAlpha = 0.5f,
                    borderColor = Color(0xffFF8B99),
                    borderColorAlpha = 0.5f,
                    borderStrokeWidth = 2f,
                    borderStrokeCap = StrokeCap.Butt
                )
            )
        )
    )
}
MIT License
Copyright (c) 2023 The Chance

permission is hereby granted, free of charge, to any person obtaining a copy
of this software and associated documentation files (the "Software"), to deal
in the Software without restriction, including without limitation the rights
to use, copy, modify, merge, publish, distribute, sublicense, and/or sell
copies of the Software, and to permit persons to whom the Software is
furnished to do so, subject to the following conditions:

The above copyright notice and this permission notice shall be included in all
copies or substantial portions of the Software.

THE SOFTWARE IS PROVIDED "AS IS", WITHOUT WARRANTY OF ANY KIND, EXPRESS OR
IMPLIED, INCLUDING BUT NOT LIMITED TO THE WARRANTIES OF MERCHANTABILITY,
FITNESS FOR A PARTICULAR PURPOSE AND NONINFRINGEMENT. IN NO EVENT SHALL THE
AUTHORS OR COPYRIGHT HOLDERS BE LIABLE FOR ANY CLAIM, DAMAGES OR OTHER
LIABILITY, WHETHER IN AN ACTION OF CONTRACT, TORT OR OTHERWISE, ARISING FROM,
OUT OF OR IN CONNECTION WITH THE SOFTWARE OR THE USE OR OTHER DEALINGS IN THE
SOFTWARE.