Simplegraph
Simplegraph is Android custom view that can generate graphs similar to the ones you see on coin trading/exchange sites.
If you clone the whole project, main app is a sample app that you can run and see simplegraph functionality in action.
Why this library is out there? Well, I've spent too much time looking for library that does only one thing, and that is, creates graph for simple representation of values over time. Sure, there are already some nice libraries out there that can do the job, but I needed something super simple and tiny. And that is why I had to create "Simplegraph". And now, if anyone needs same functionality in their projects, here it is.
Usage is as simple as posible. View takes series of float numbers (Y axis points) and draws the graph. X-axis point values are not needed since library uses same spacing between each consecutive point.
Sample Usage
To use view in your own project simply use linegraph view in your project, like:
<com.bandiago.libs.simplegraph.LineGraph
            xmlns:linegraph="http://schemas.android.com/apk/res-auto"
            android:id="@+id/lineGraph"
            android:layout_width="200dp"
            android:layout_height="50dp"

            linegraph:lineThickness="2"
            linegraph:lineColor="#000000"

            android:background="#e2d3d3"/>
There are two properties you can use in the view. Their names are self-explanatory:
- lineThickness
- lineColor
and then in your code you can do something like this:
        val lineGraph = findViewById<LineGraph>(R.id.lineGraph)
        val series = arrayOf(0f, 1f, 2f, 8f, 5f, 13f, 4f, 3f, 0f)
        lineGraph.addSeries(series)
To use simplegraph in your projects add dependency in app's build.gradle file
dependencies {
    implementation 'com.bandiago.libs:simplegraph:0.0.2'
}
Example of use
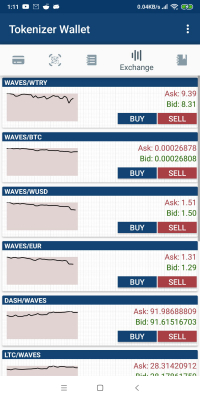
Screenshot is taken from the app: "Tokenizer Wallet" by Bandiago. You can find it on Play Store and if you are into crypto it's worth checking out.