ChartPOC
Chart POC-Android
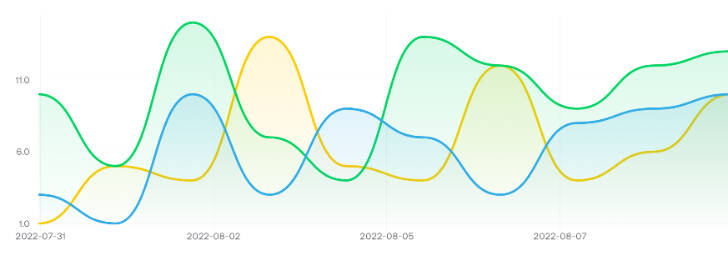
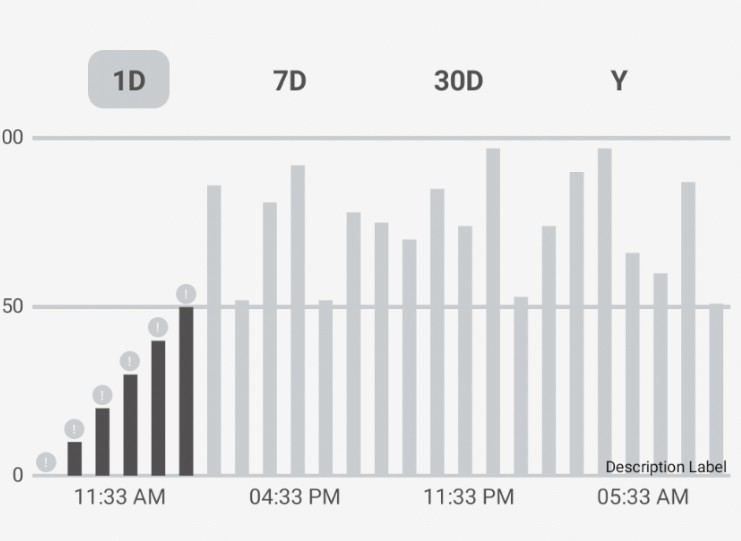
Time Frame Bar Chart Component
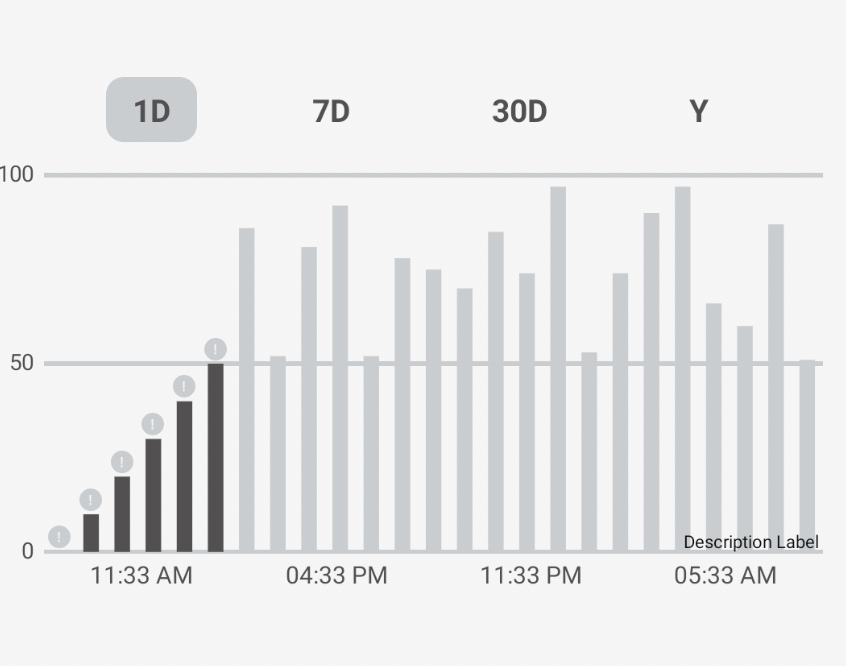


To use the component just include it into the XML as
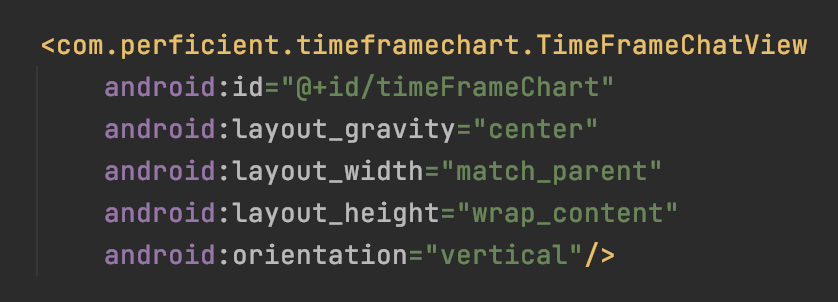
Then, set chartData by creating a ChartData object. It receives a list of ChartTimeFrame
For example (Creating random data for 1 year or 12 months)
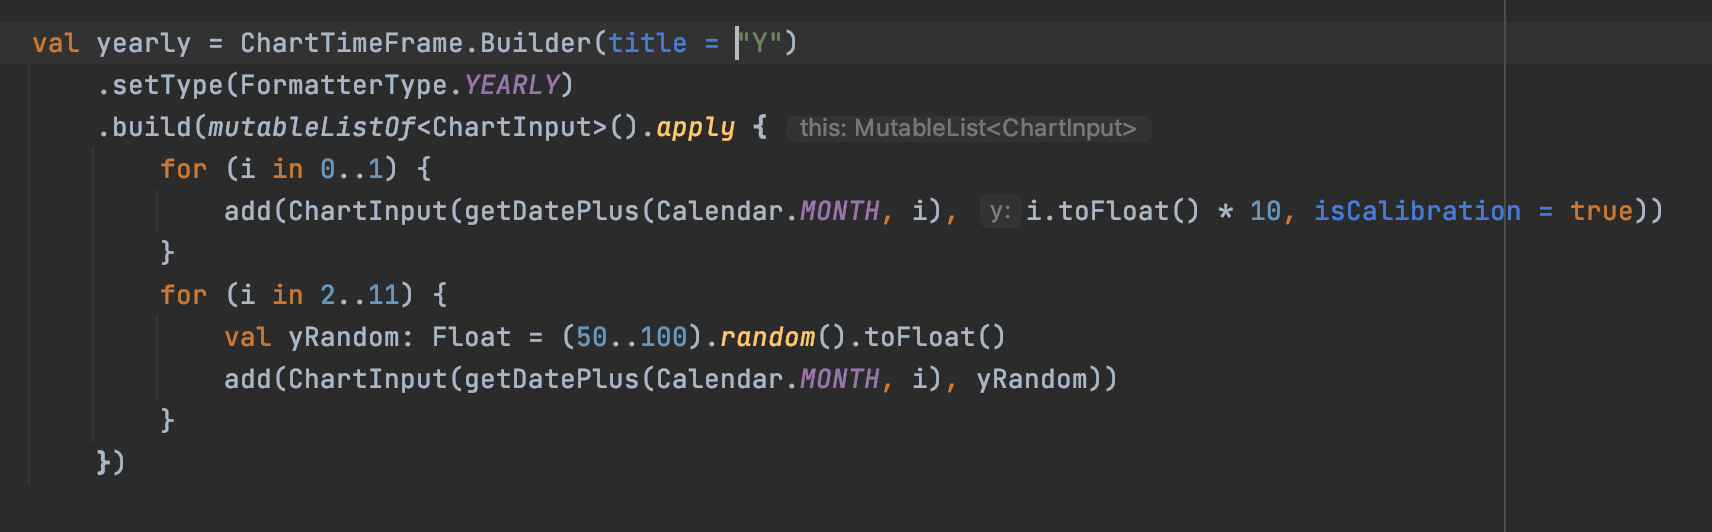
Please keep in mind, the Y axis are float values and X values are always Date values (time axis)
Then, add the time frame to the ChartData

and use the chartData in the View to show the info