AAInfographics
An elegant and friendly chart library for Android developer who use Kotlin. Powerful,support the column chart、bar chart、area chart、area spline chart、line chart、spline chart、radar chart、polar chart、pie chart、bubble chart、pyramid chart、funnel chart、column range chart and other graphics.
Preface
AAInfographics is the Kotlin language version of AAChartKit which is object-oriented, a set of easy-to-use, extremely elegant graphics drawing controls,based on the popular open source front-end chart library Highcharts. It makes it very fast to add interactive charts to your mobile projects. It supports single touch-drag for data inspection, multi-touch for zooming, and advanced responsiveness for your apps .
Features
- Support
Android、Kotlin&Java. - Powerful,support the
column chart、bar chart、area chart、areaspline chart、line chart、spline chart、radar chart、polar chart、pie chart、bubble chart、pyramid chart、funnel chart、columnrange chartand other graphics. - Interactive、animated, the
animationeffect is exquisite 、delicate、 smooth and beautiful. - Support
chain programming syntaxlike system framework. AAChartView + AAChartModel = ChartIn the AAInfographics,it follows a minimalist formula:Chart view + Chart model = The chart you want. Just like the other powerful charts framework AAChartKit、AAChartKit-Swift、AAChartCore.
Appreciation


Installation
Manually (old school way)
- Download whole project demo of
AAInfographicsDemo - Drag the folder
AAInfographicsinto your project.
Usage
- Creat the instance object of chart view:
AAChartView
- Configure the properties of chart model:
AAChartModel
- Draw the chart(This method is called only for the first time after you create an AAChartView instance object)
???Congratulations! Everything was done!!! You will get what you want!!!
Update chart content
if you want to refresh chart content,you should do something as follow.According to your actual needs, select the function that fits you.
- Only refresh the chart data(This method is recommended to be called for updating the series data dynamically)
- Refresh the chart, minus the chart data (this method is recommended for subsequent refreshes after the first drawing of graphics has completed. If you want to update the chart data only, you should use the function
aa_onlyRefreshTheChartDataWithChartModelSeries)
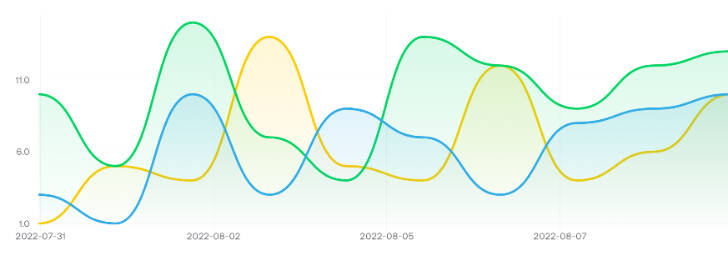
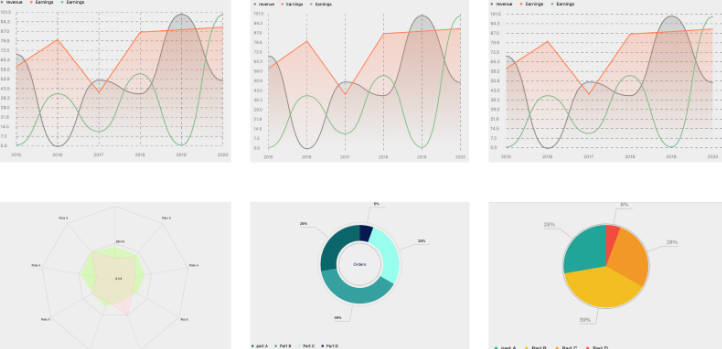
Infographics sample
-
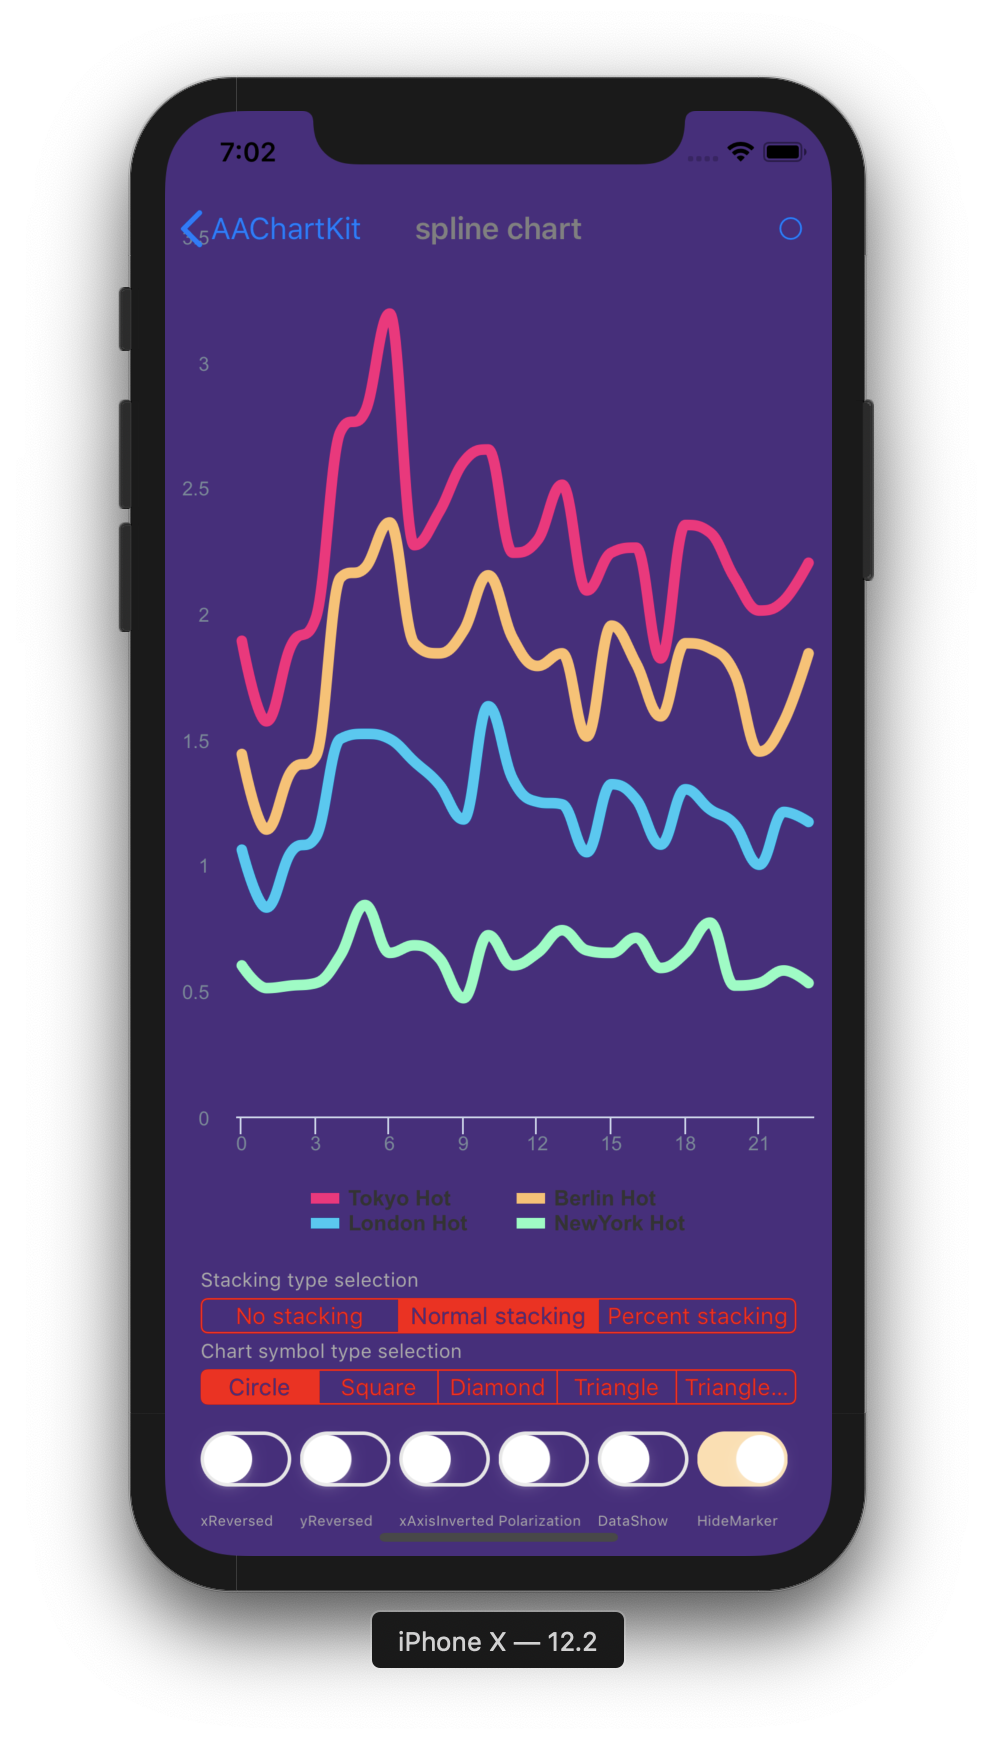
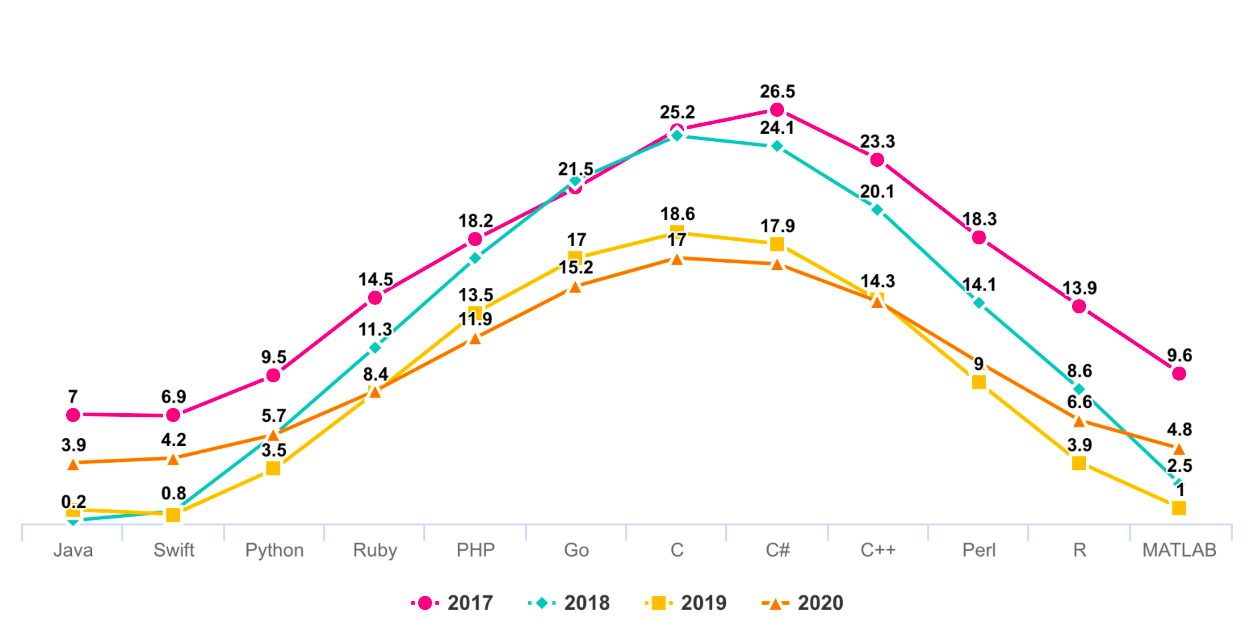
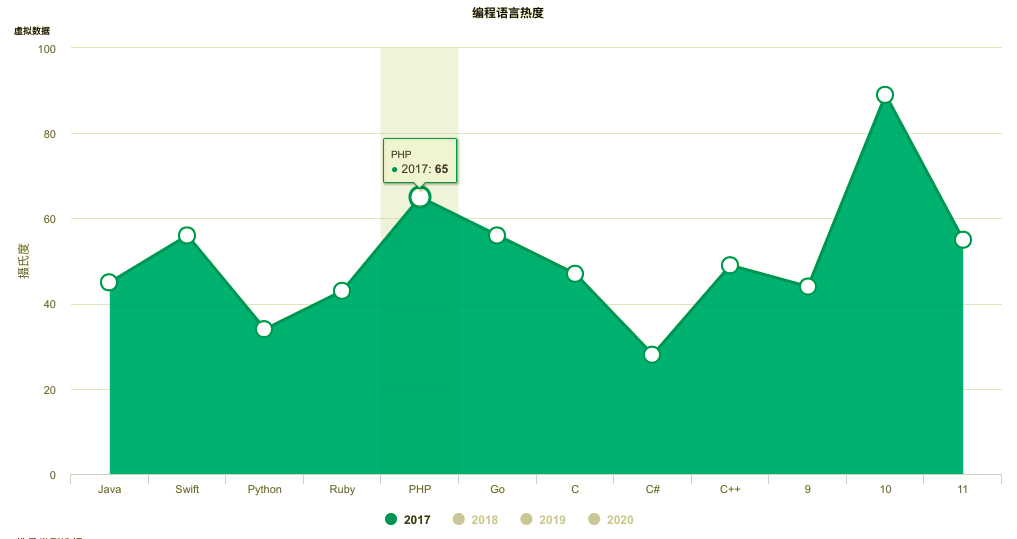
line chart
-
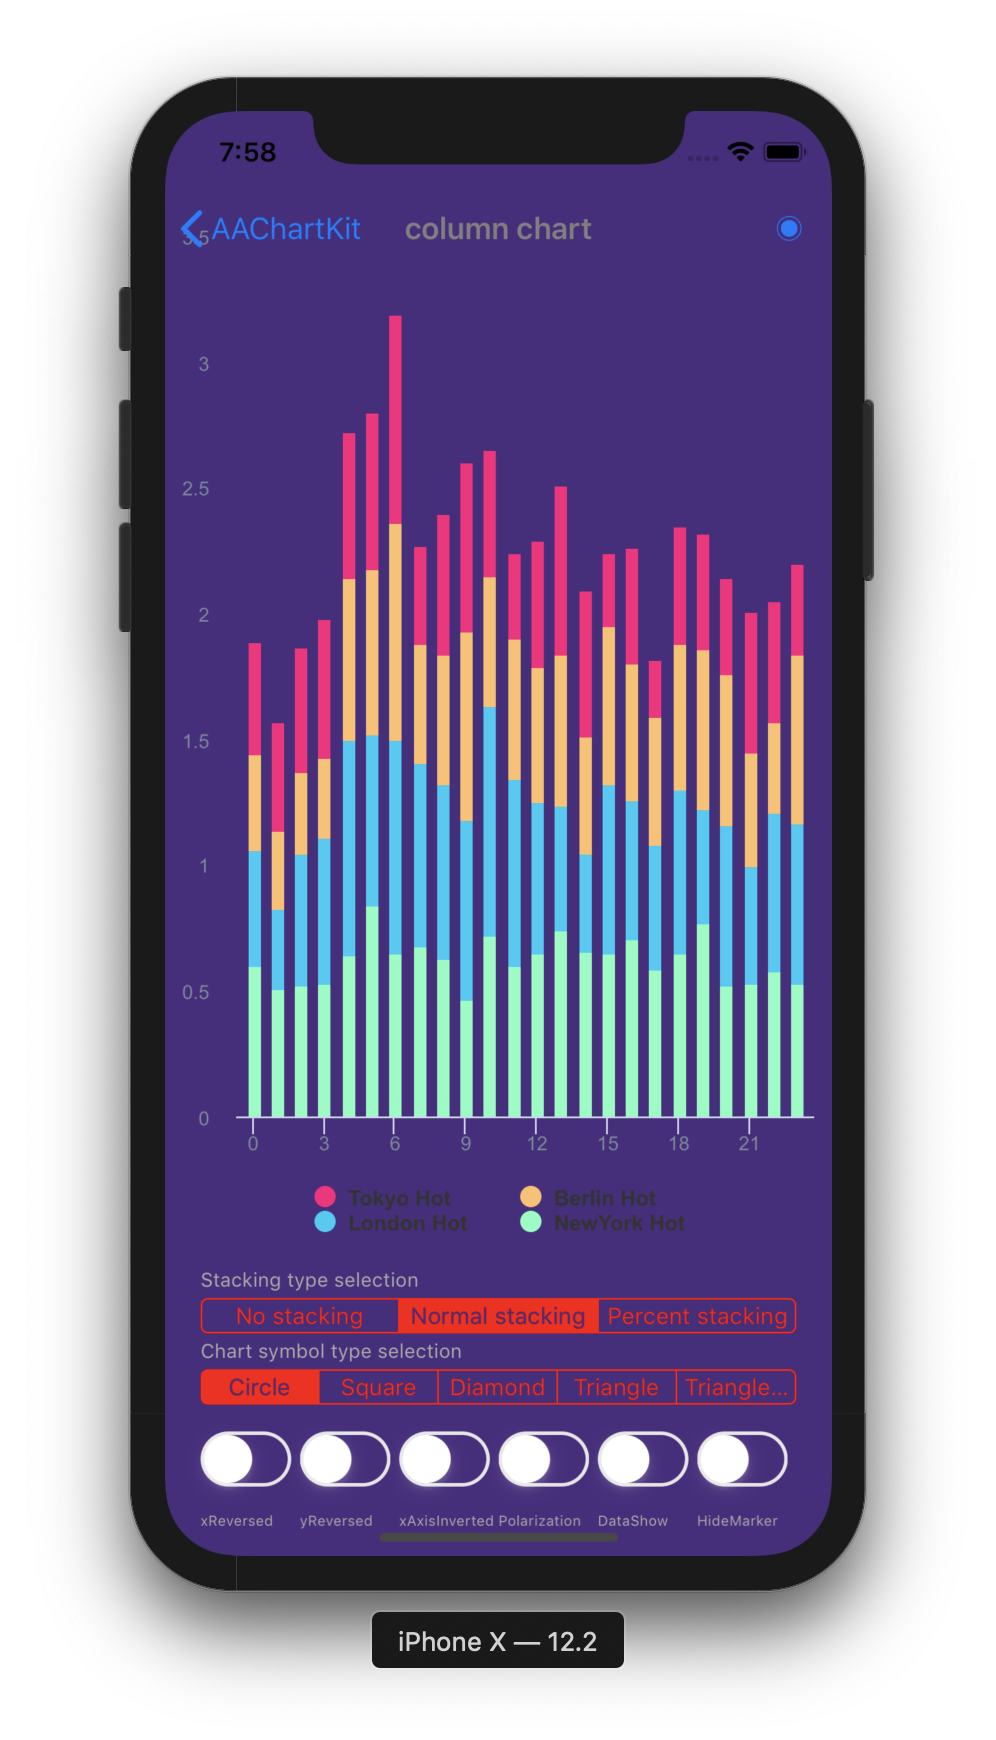
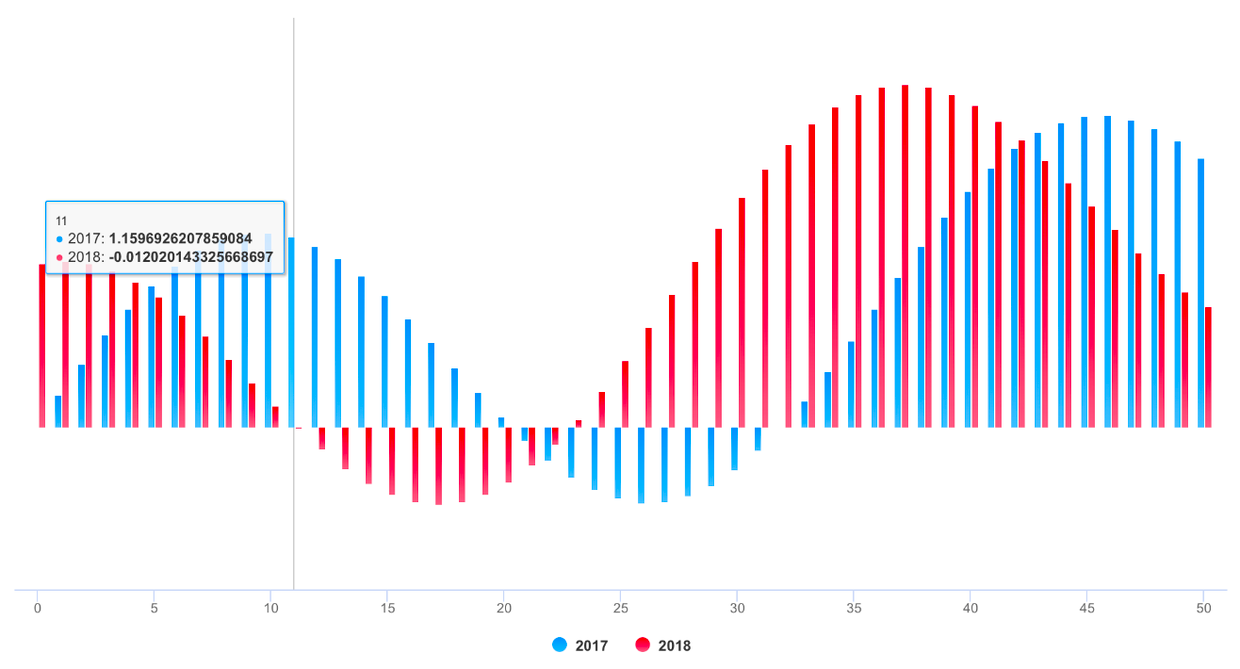
column chart
-
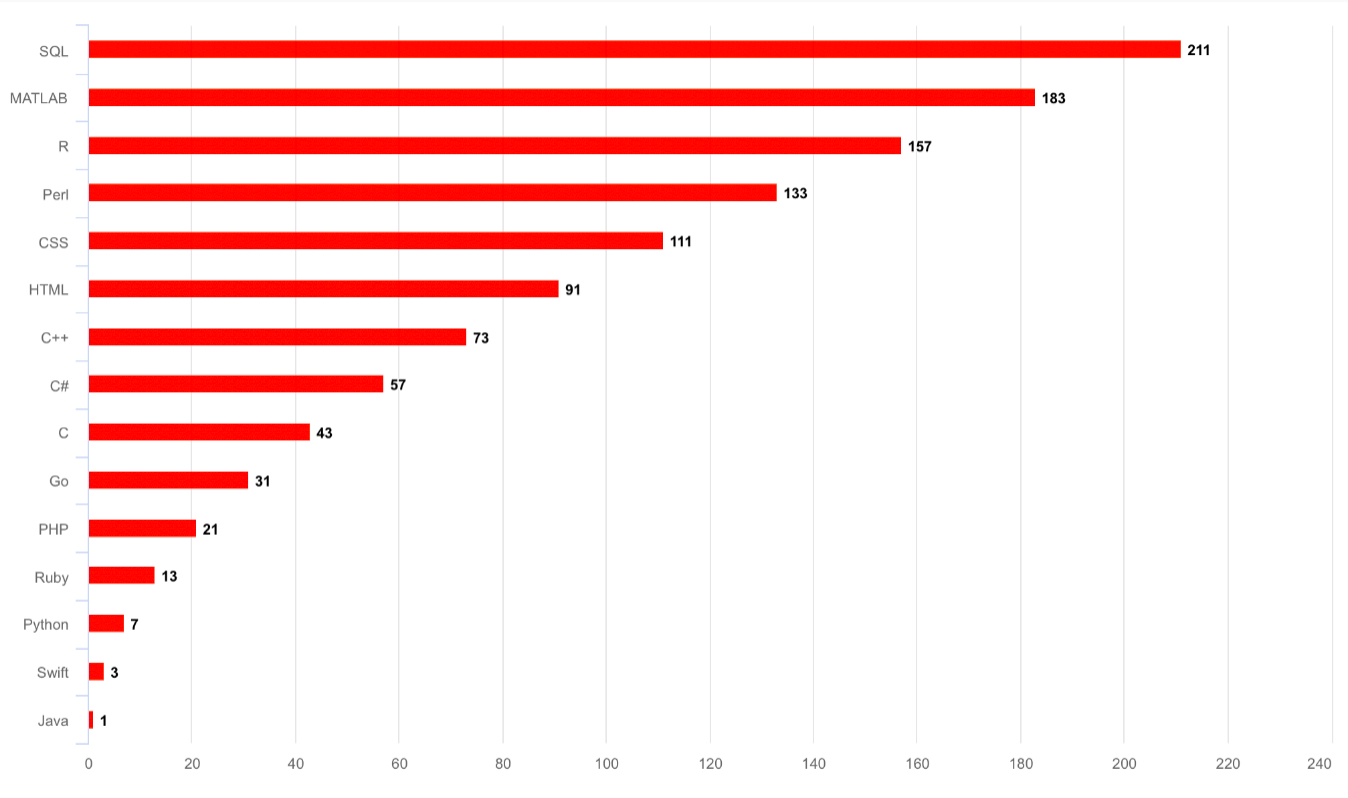
bar chart
-
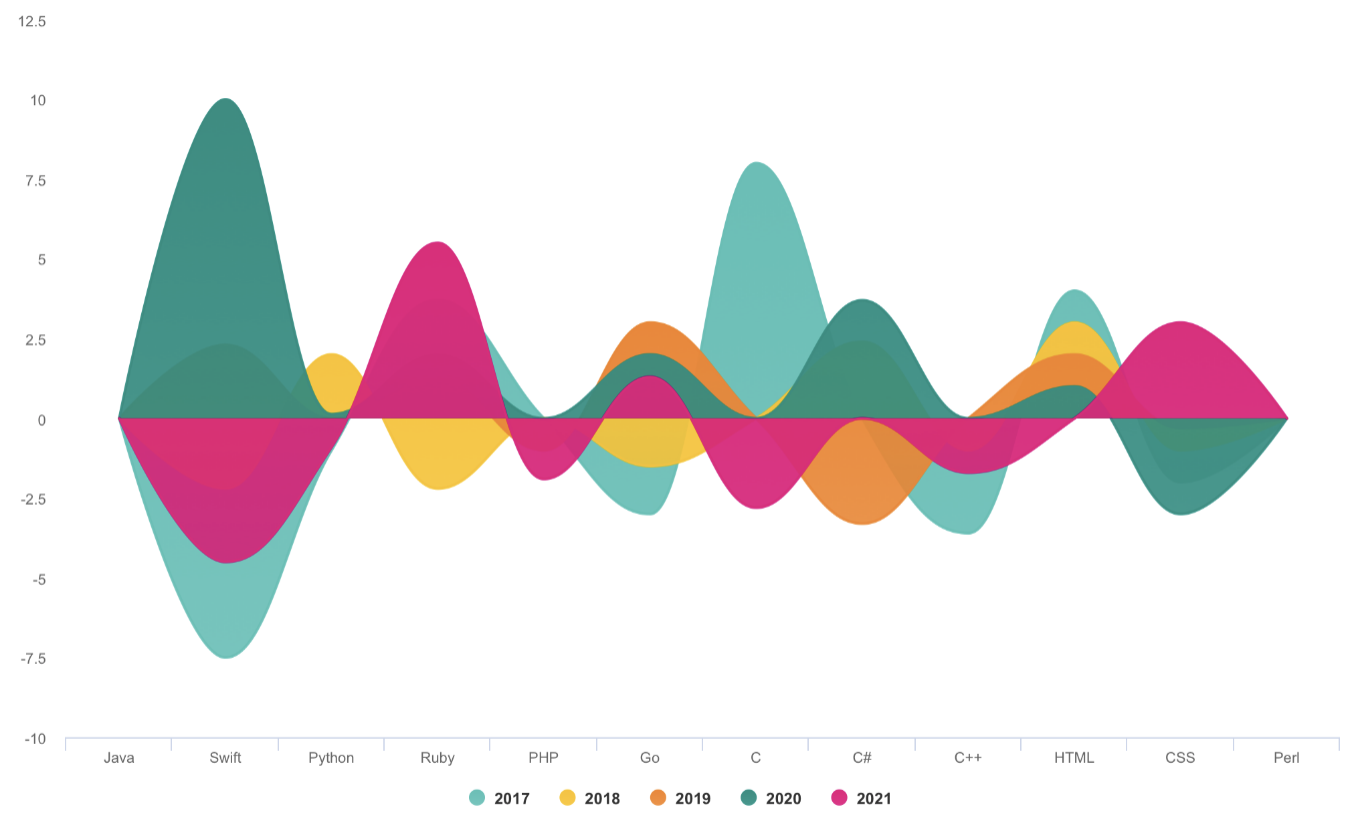
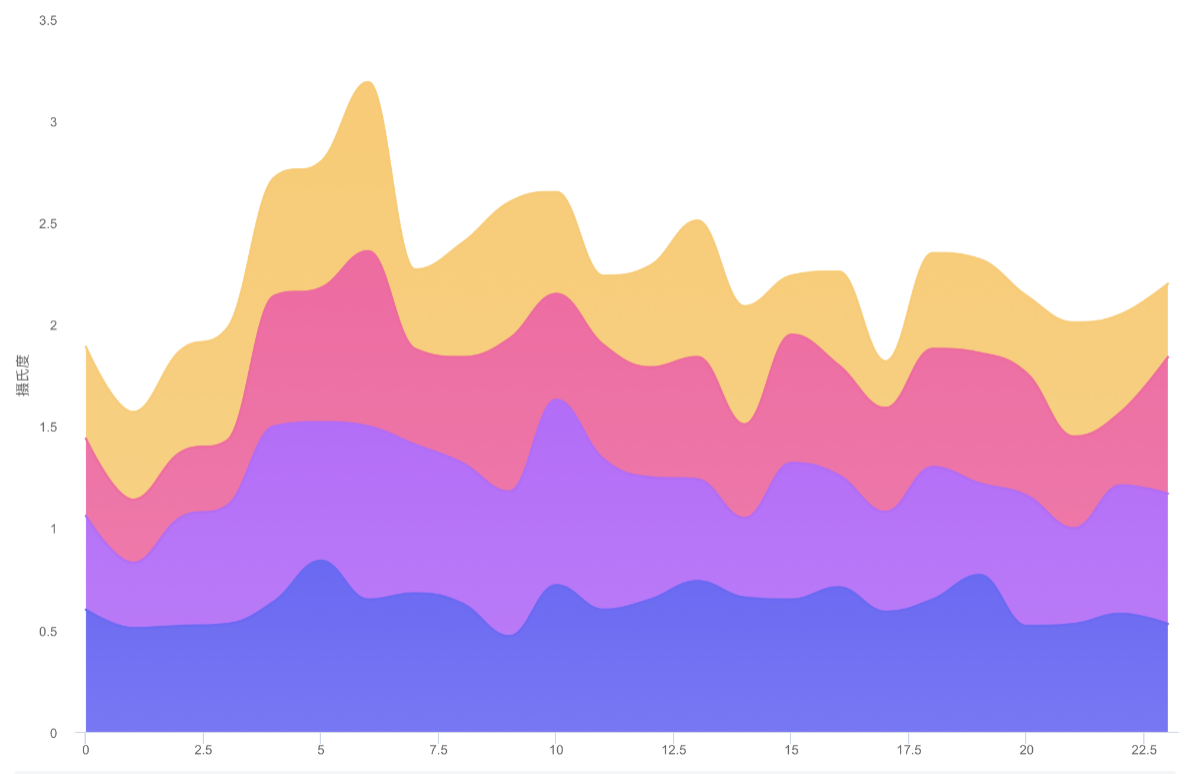
special area chart one
-
special area chart two
-
special area chart three
-
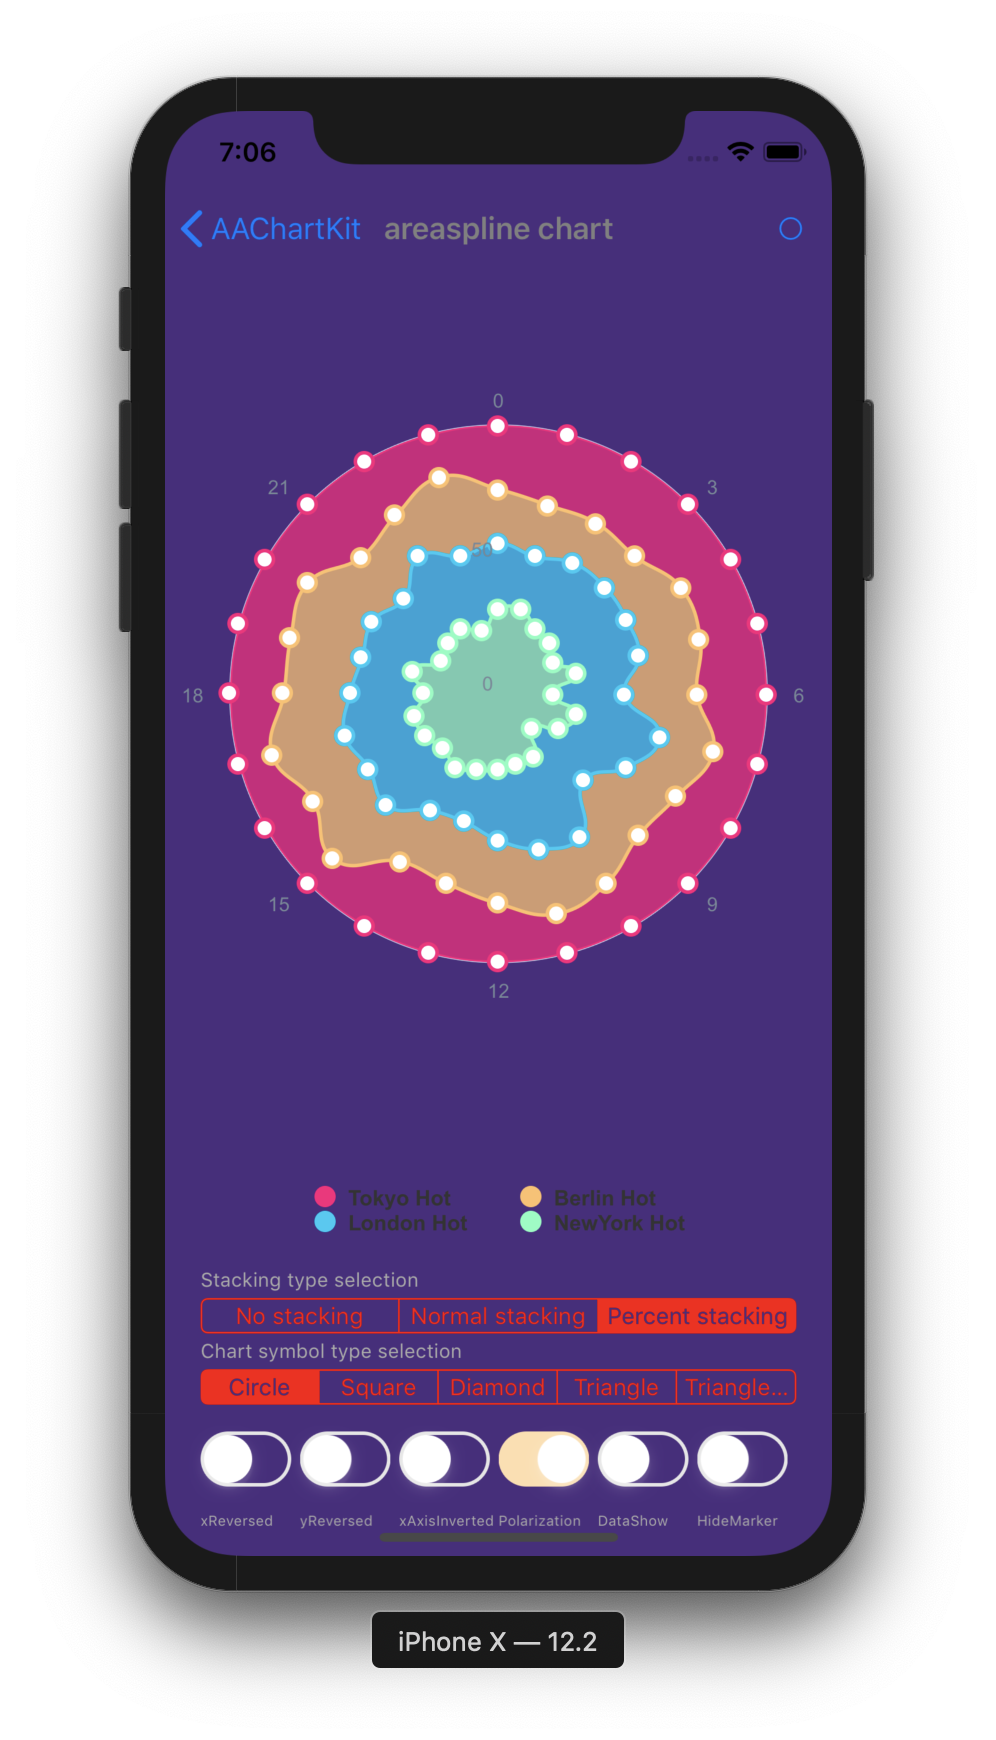
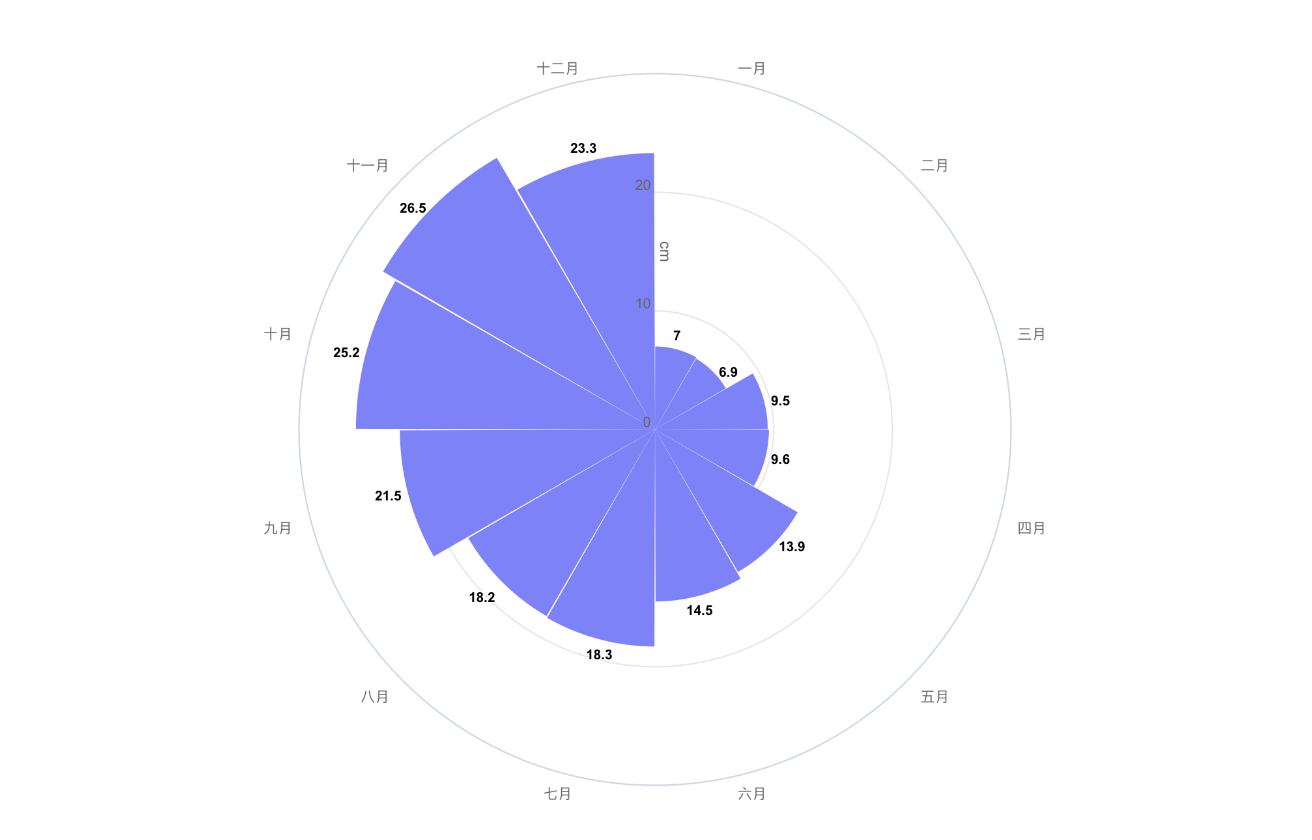
polar chart
-
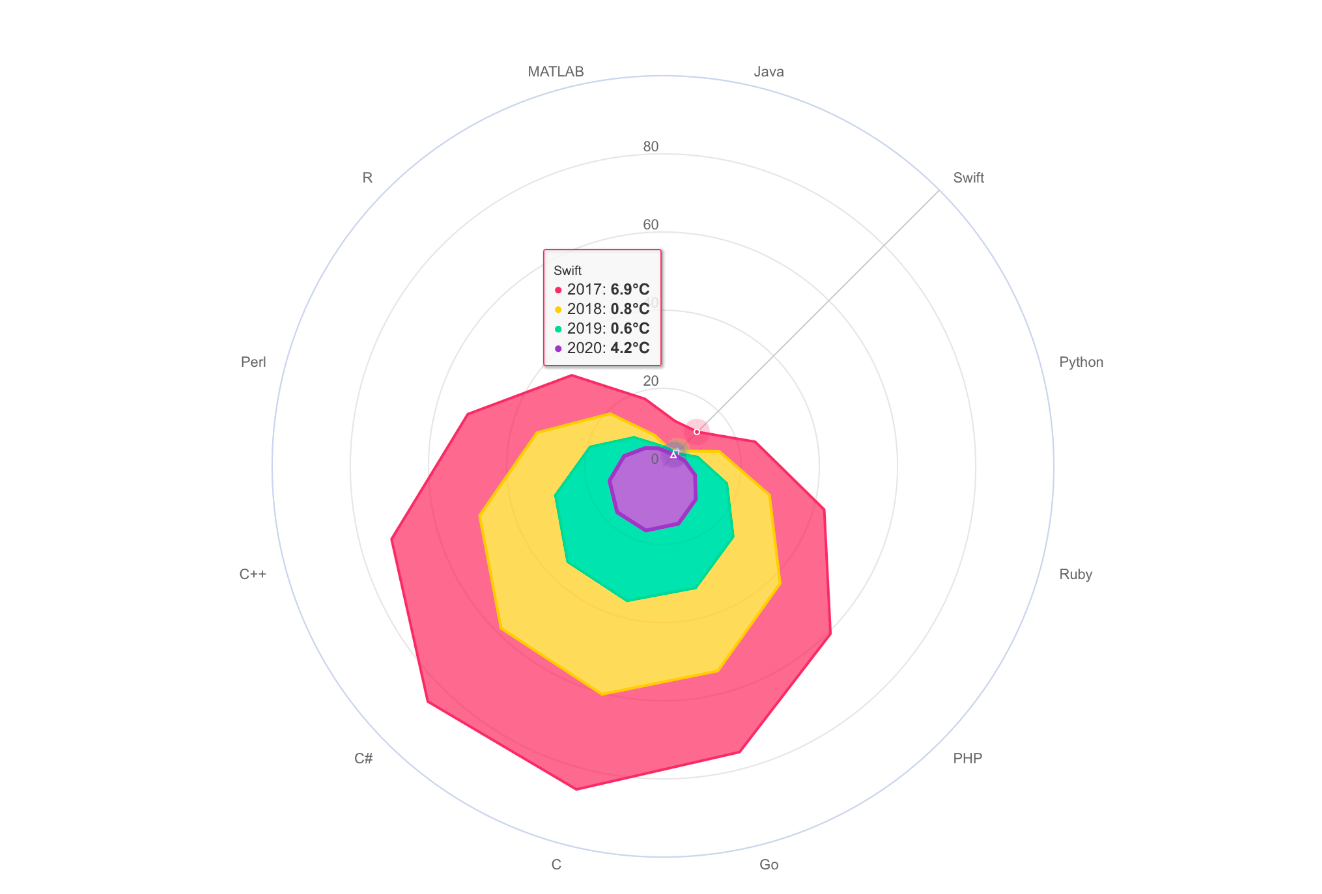
radar chart
-
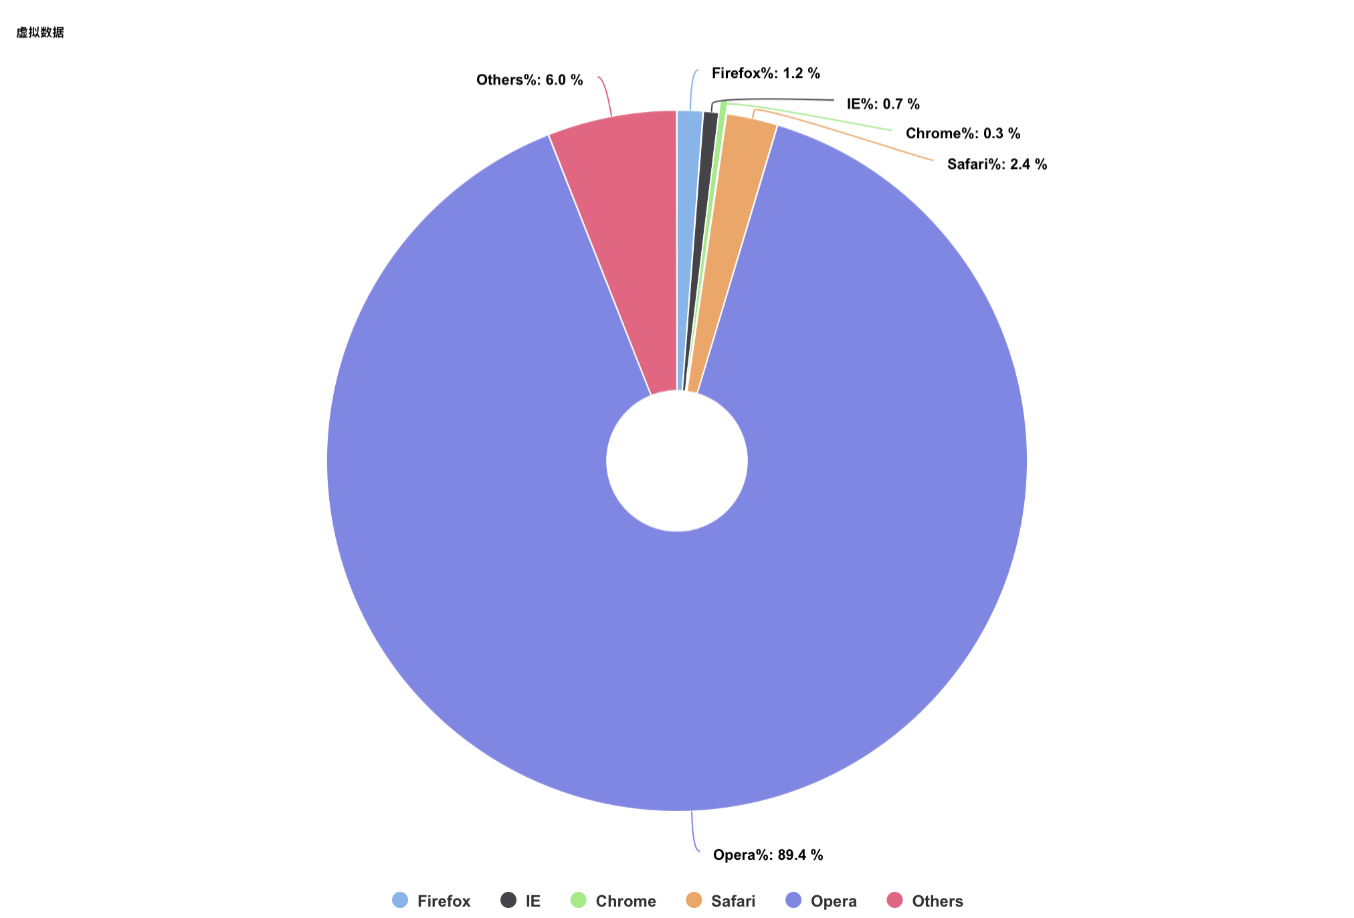
pie chart
-
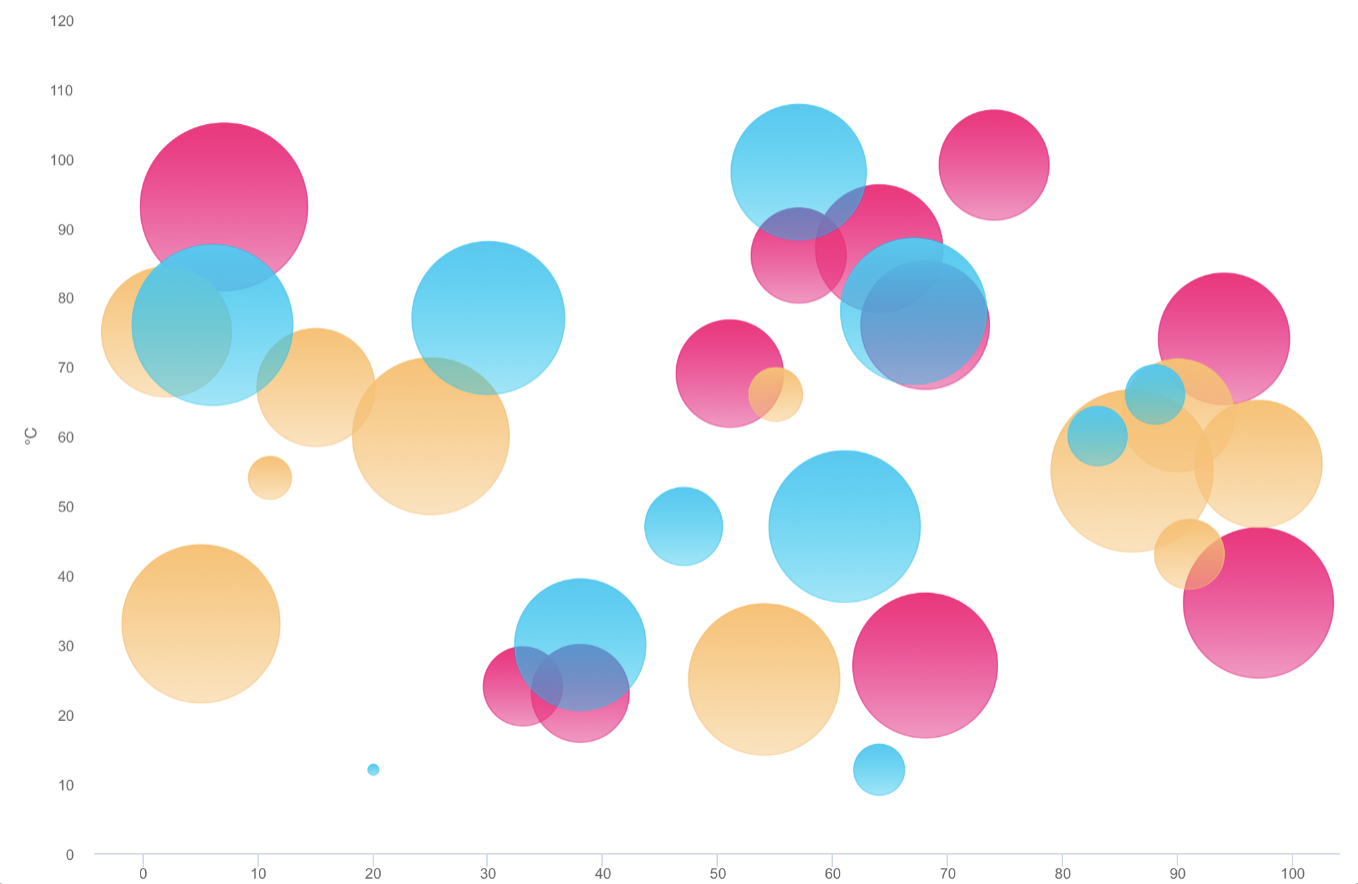
bubble chart
-
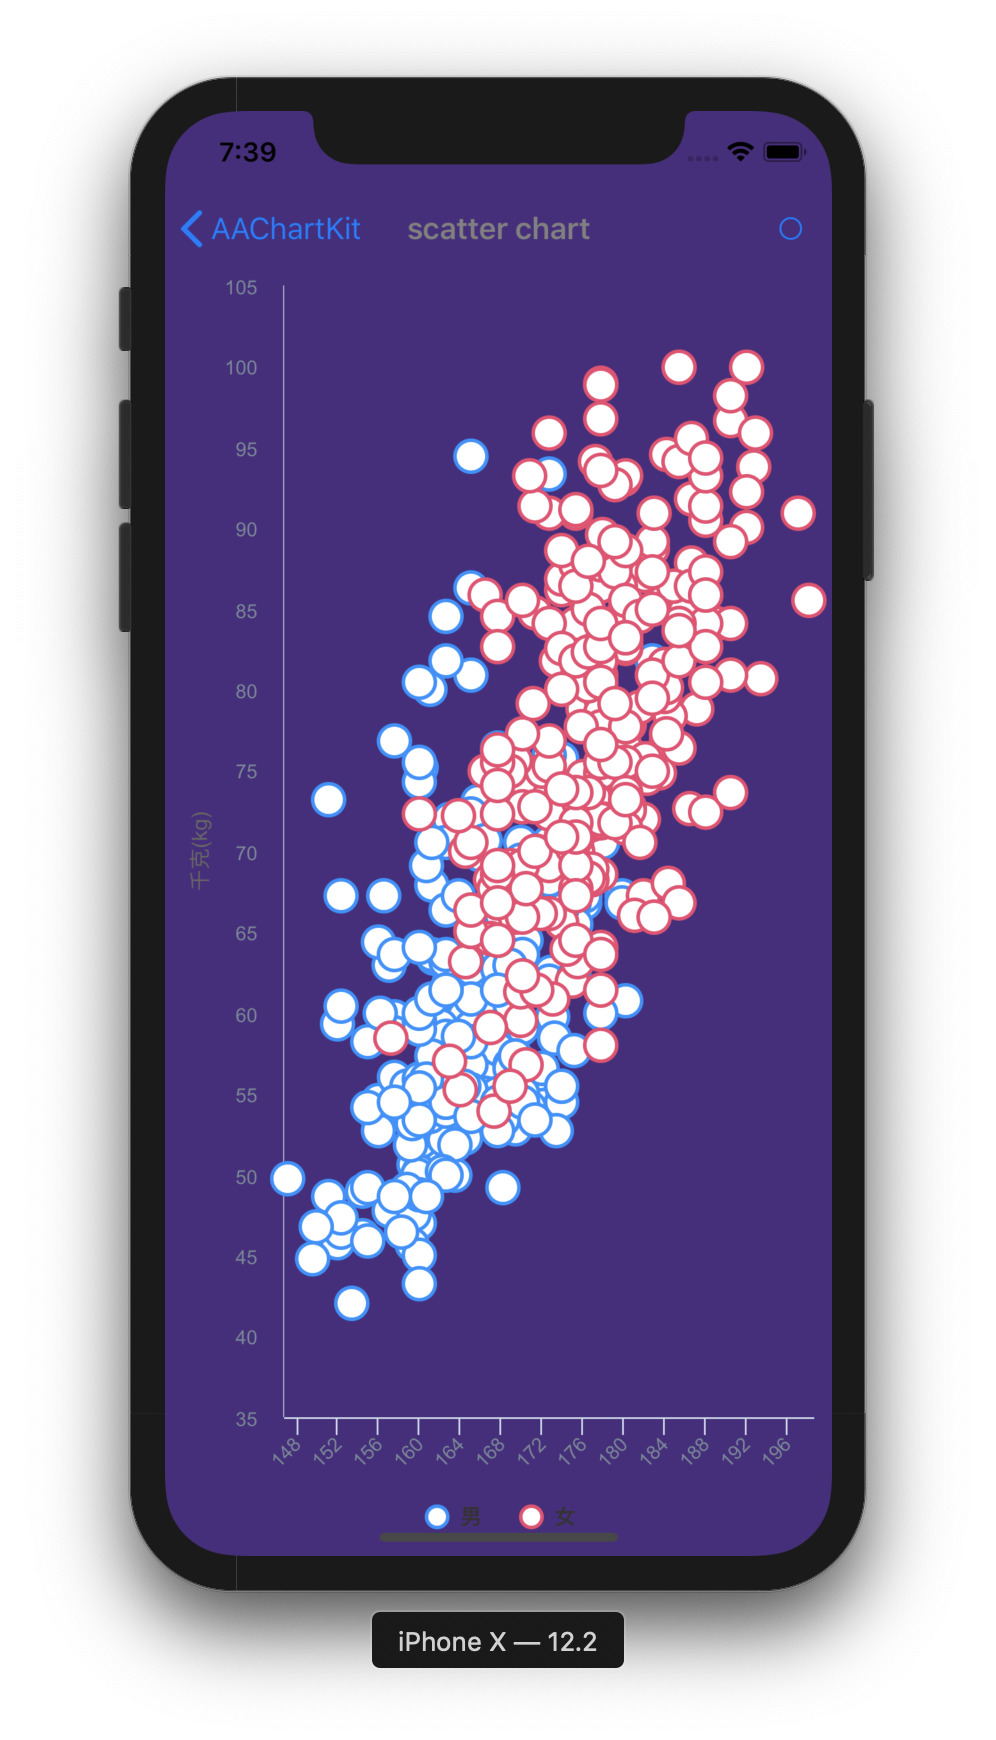
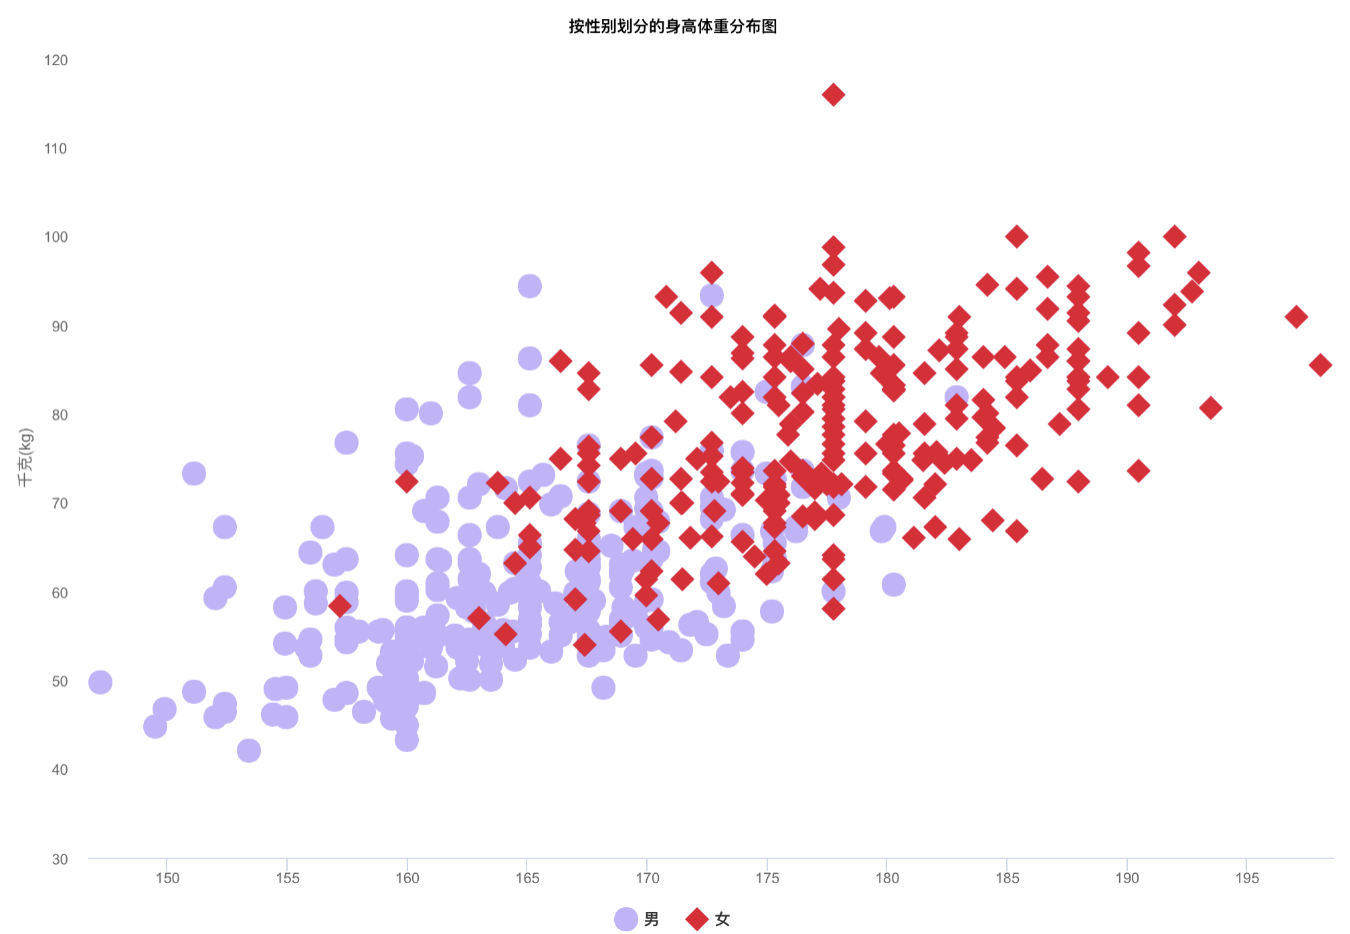
scatter chart
-
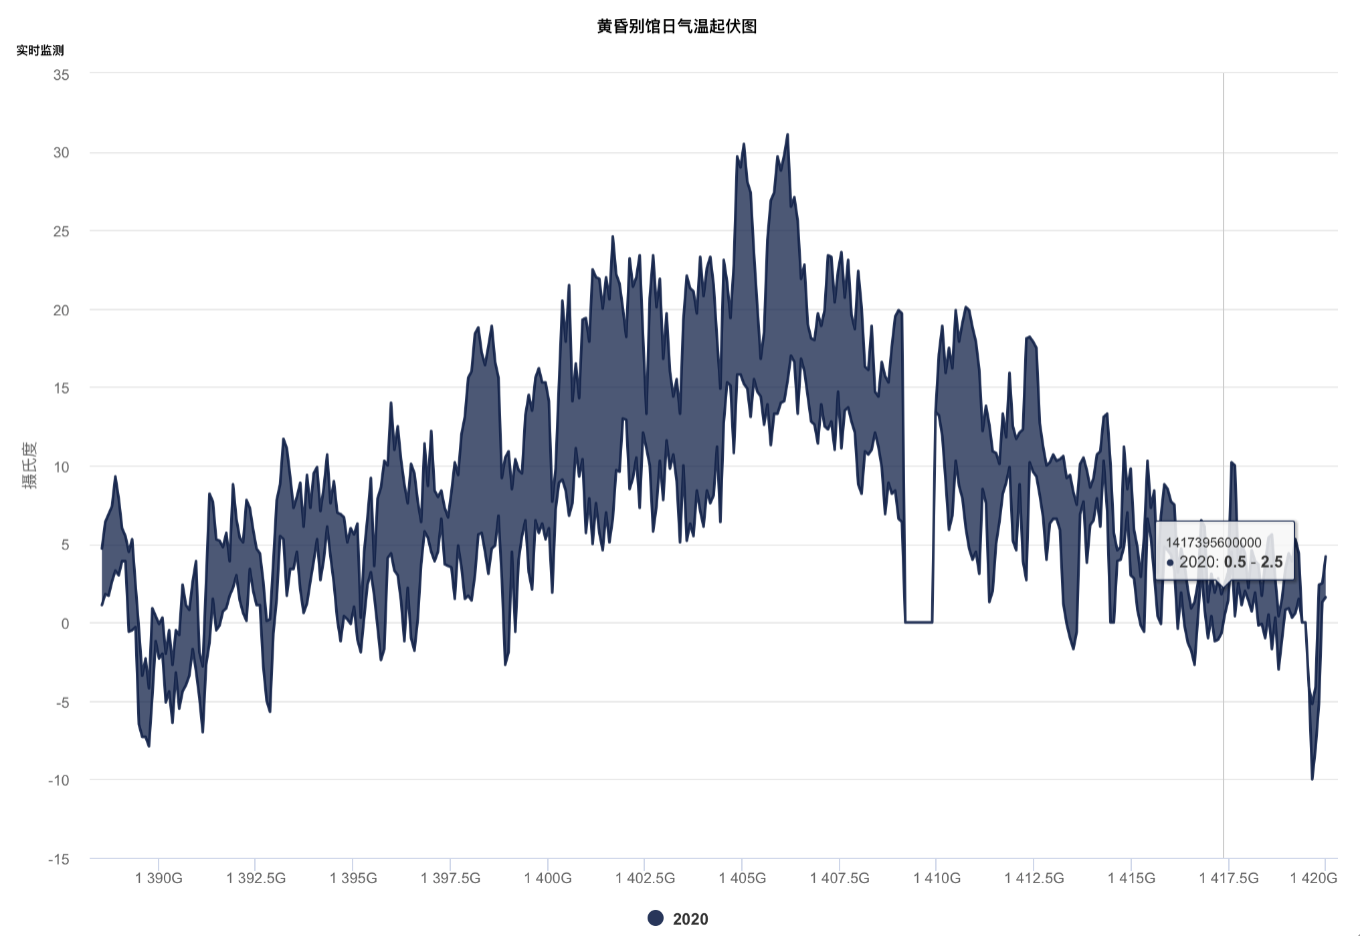
arearange chart
-
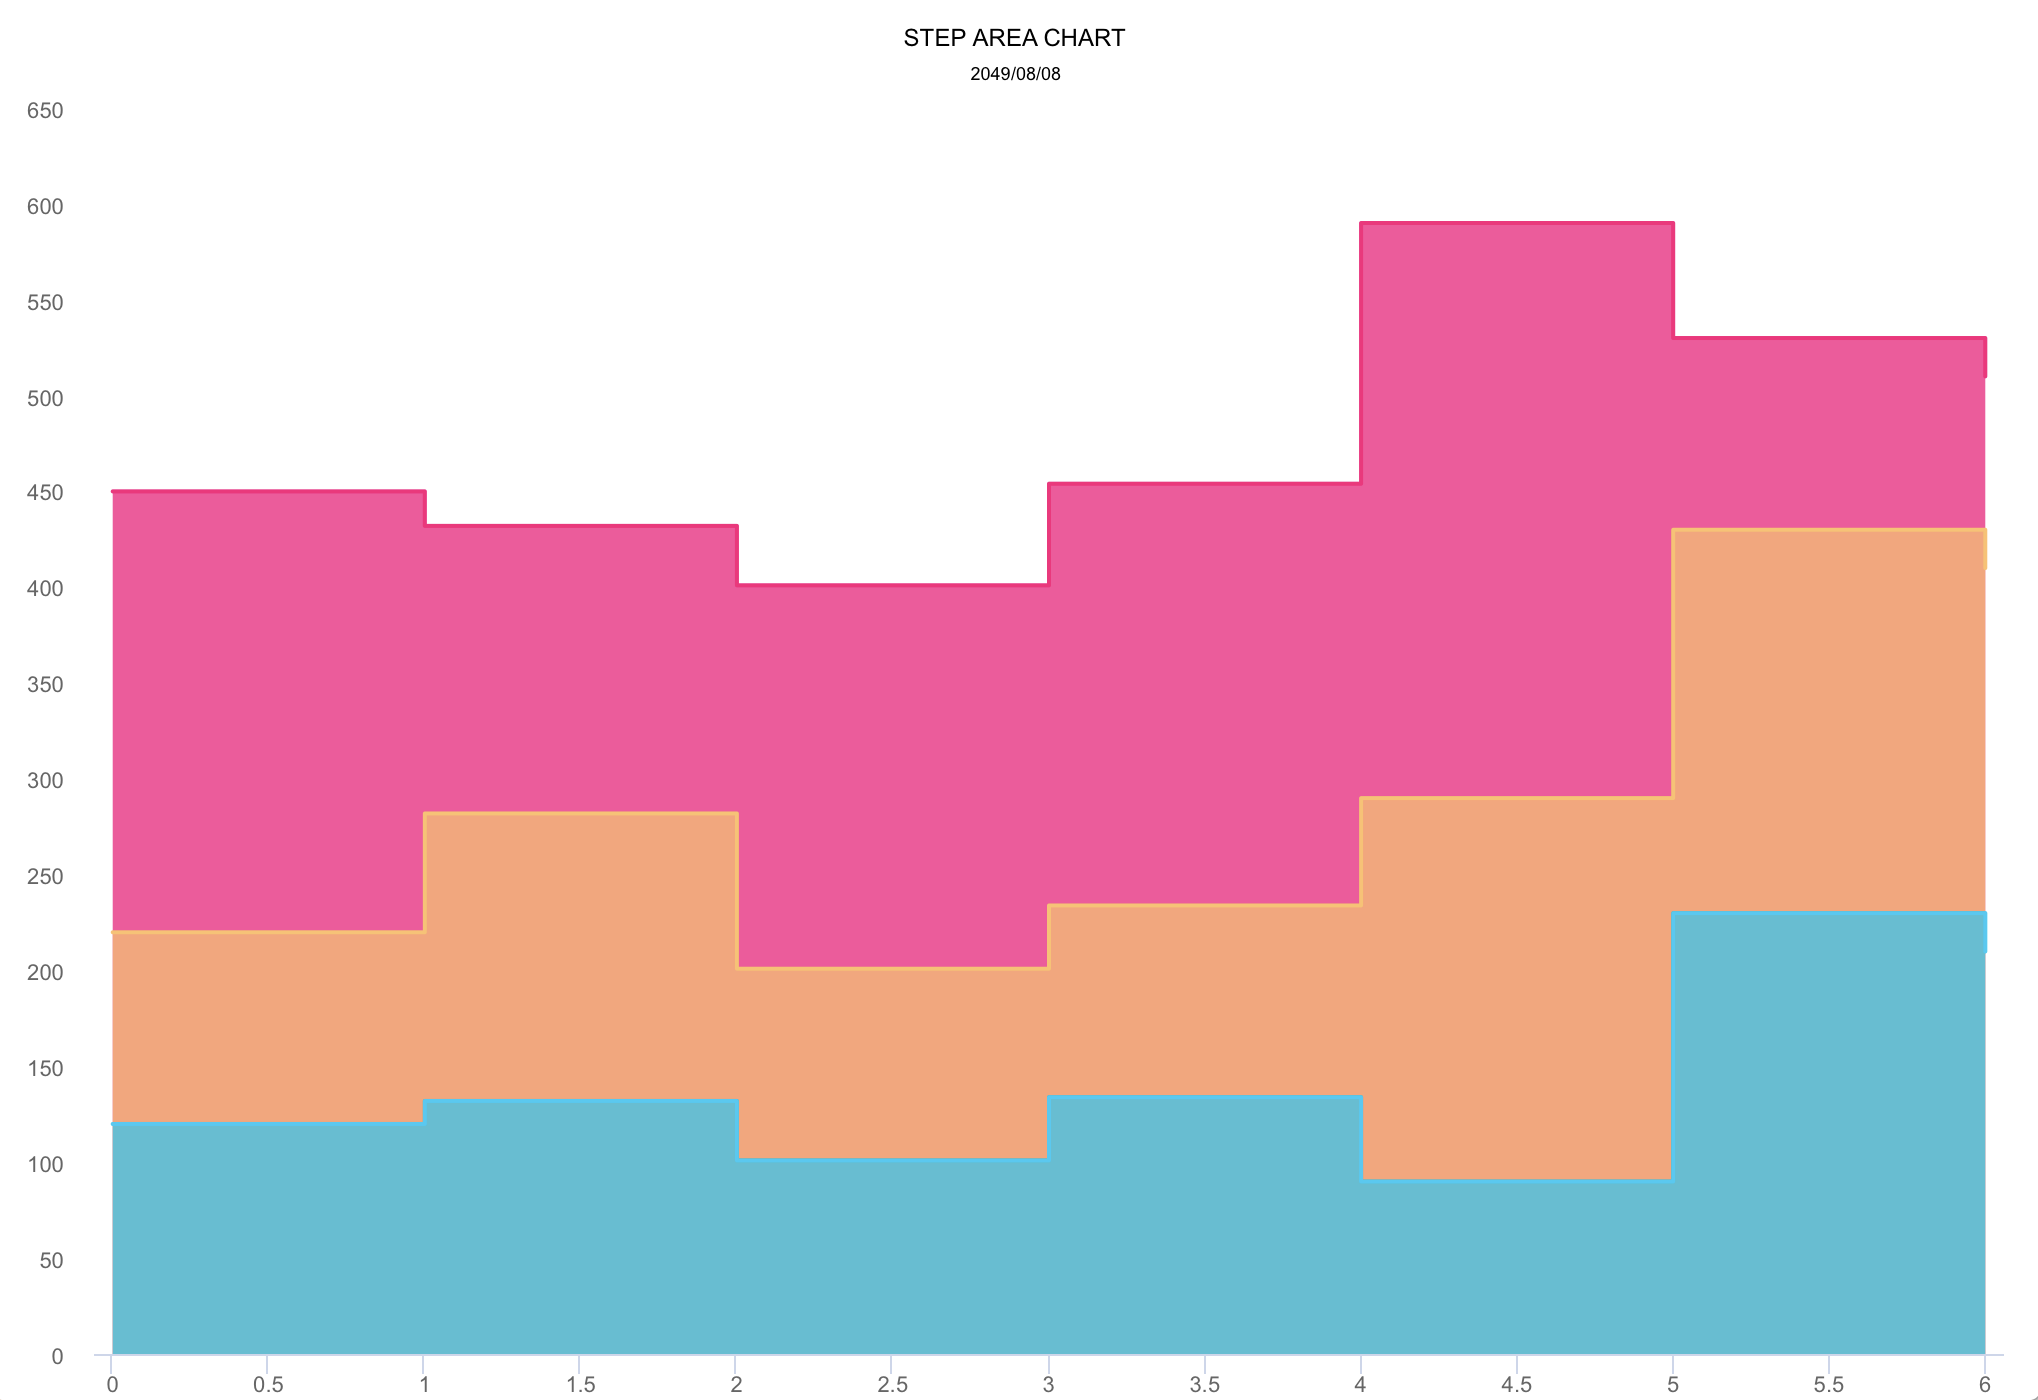
step area chart
-
mixed chart
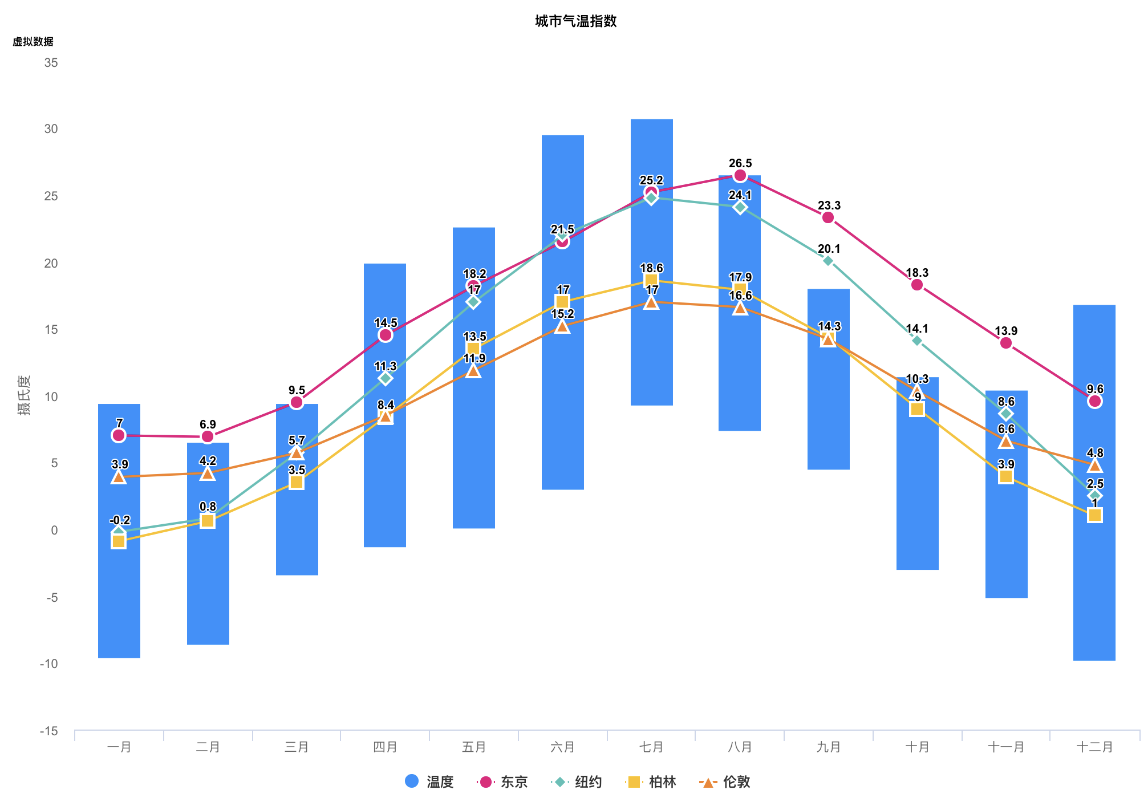
More graphics
- Note: The following
DEMO pictureis aGIF dynamic picturewhich has a size of around 6M. If you don't see any dynamic preview, then this is because the picture resources were not fully loaded. In such a case please be patient and wait for the contents to finish loading. Maybe you need to reload this page.
Special instructions
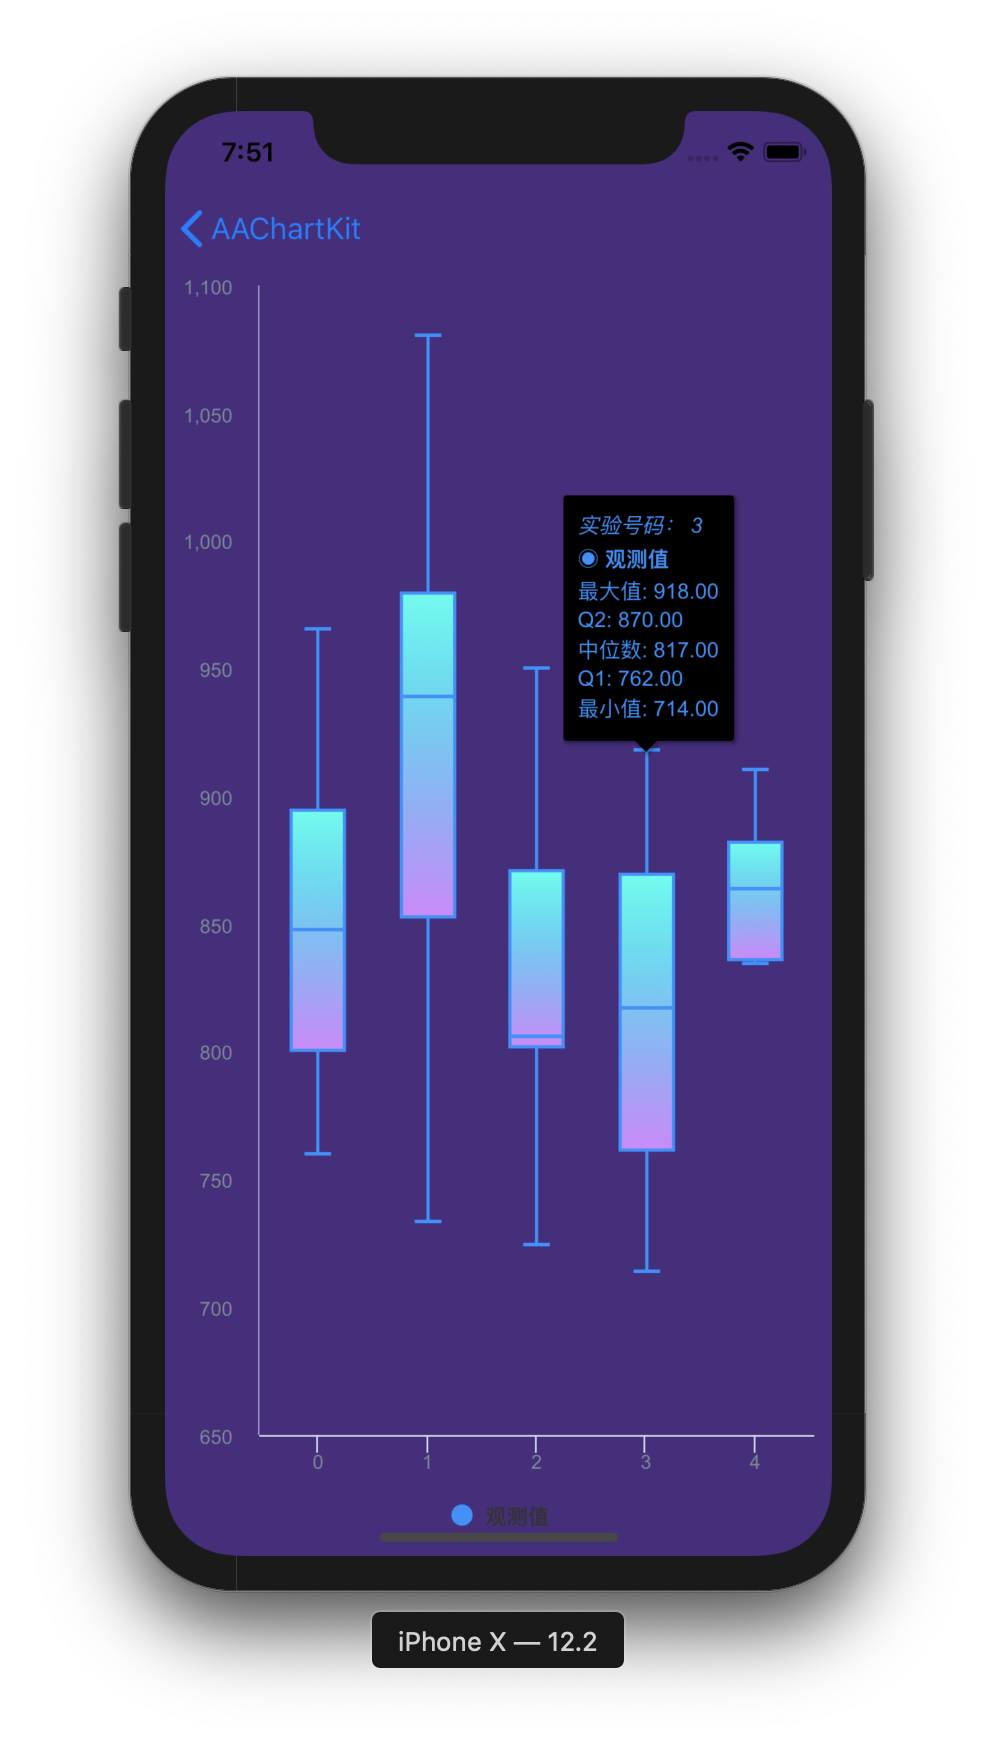
Support user click events and move over events
you can monitor the user touch events message through implementing delegate function for AAChartView instance object
The received touch events message contain following content
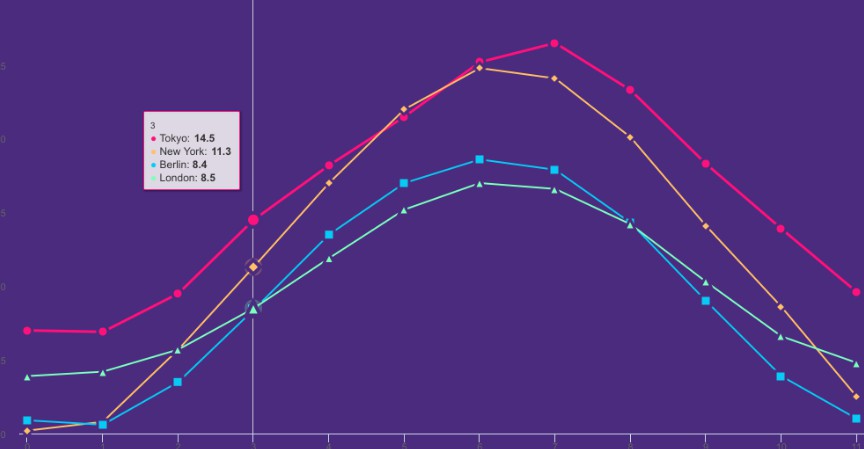
Support for custom the style of chart AATooltip through JavaScript function
As we all know, AAInfographics support using HTML String. Most of time, the headerFormat 、pointFormat、footerFormat HTML string is enough for customizing chart tooltip string content, However, sometimes the needs of APP is so weird to satified, in this time, you can even customize the chart tooltip style through JavaScript function.
For example, configuring AATooltip instance object properties as follow:
you can get the customized tooltip style chart like this?

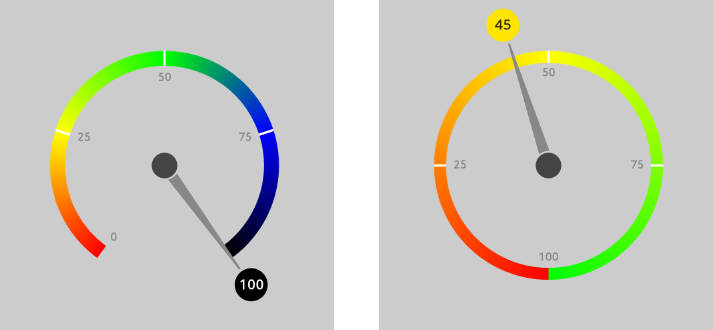
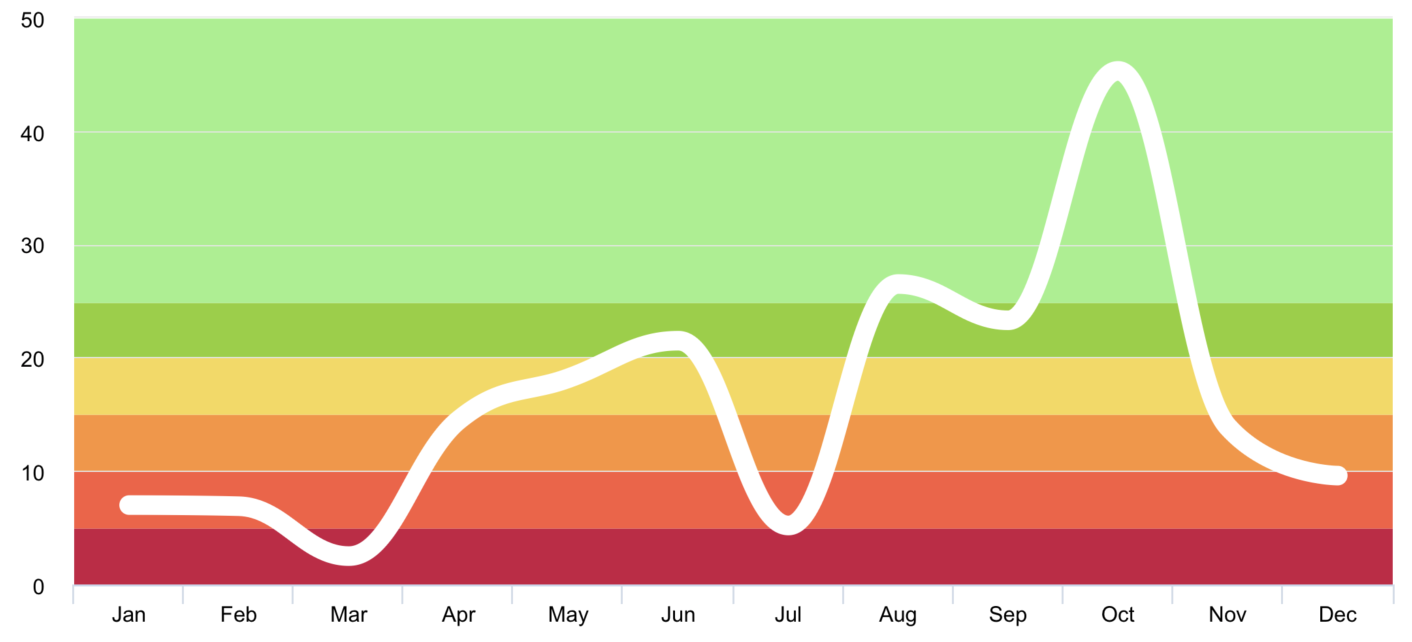
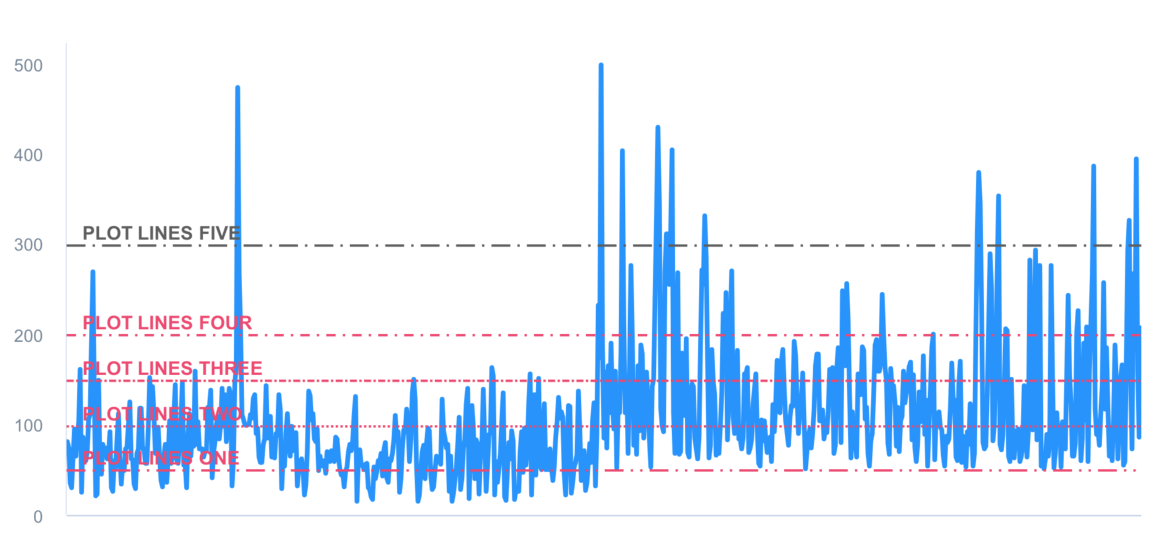
Support value range segmentation
-
chart with value range segmentation
bands ?
-
chart with value range segmentation
lines ?
Supported chart type for now
Supported zoom guesture types for now
Supported animation type for now
Here are the ten concrete animation types of AAInfographics
| Back | Bounce | Circ | Cubic | Elastic |
|---|---|---|---|---|
| ![][1] | ![][2] | ![][3] | ![][4] | ![][5] |
| Expo | Quad | Quart | Quint | Sine |
|---|---|---|---|---|
| ![][6] | ![][7] | ![][8] | ![][9] | ![][10] |
About AAChartModel
-
AAChartModel:chart basic properties instruction
| Property name | Description | Value Range |
|---|---|---|
| title | The chart title | Any valid string |
| subtitle | The chart subtitle | Any valid string |
| chartType | The default series type for the chart. Can be any of the chart types listed under AAChartType. |
AAChartType.Column, AAChartType.Bar, AAChartType.Area, AAChartType.AreaSpline, AAChartType.Line, AAChartType.Spline, AAChartType.Pie, AAChartType.Bubble, AAChartType.Scatter, AAChartType.Pyramid, AAChartType.Funnel, AAChartType.Arearange, AAChartType.Columnrange |
| stacking | Whether to stack the values of each series on top of each other. Possible values are null to disable, "normal" to stack by value or "percent". When stacking is enabled, data must be sorted in ascending X order | AAChartStackingType.None, AAChartStackingType.Normal, AAChartStackingType.Percent |
| symbol | A predefined shape or symbol for the marker. When null, the symbol is pulled from options.symbols. Other possible values are "circle", "square", "diamond", "triangle" and "triangle-down" | AAChartSymbolType.Circle, AAChartSymbolType.Square, AAChartSymbolType.Diamond, AAChartSymbolType.Triangle, AAChartSymbolType.TriangleDown |
| colorsTheme | the colors theme of chart style | default value is arrayOf("#fe117c", "#ffc069", "#06caf4", "#7dffc0") |
| series | the series data of chart | a list made of AASeriesElement instance objects ,every AASeriesElement has its own type 、name、data、color、opacity value ect |
-
AAChartModel:chart all properties list
Postscript
If you want to shrink the size of the AAInfographics lib ,you should do something like this:
- Delete the
.jsfile ofAAJSFilesfolder inAAInfographics,The names of multiple files that need to be deleted are as follows
- AAHighchartsLib.js
- AAHighchartsMore.js
- AAFunnel.js
2.Change the content of AAChartView.html file
to be