DebugDrawer
A configurable debug drawer to use in your Android app. Inspired by u2020.
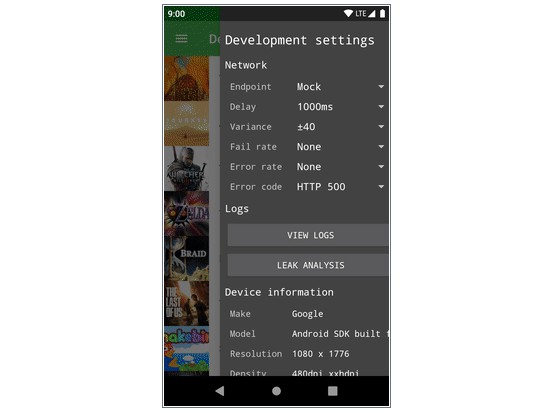
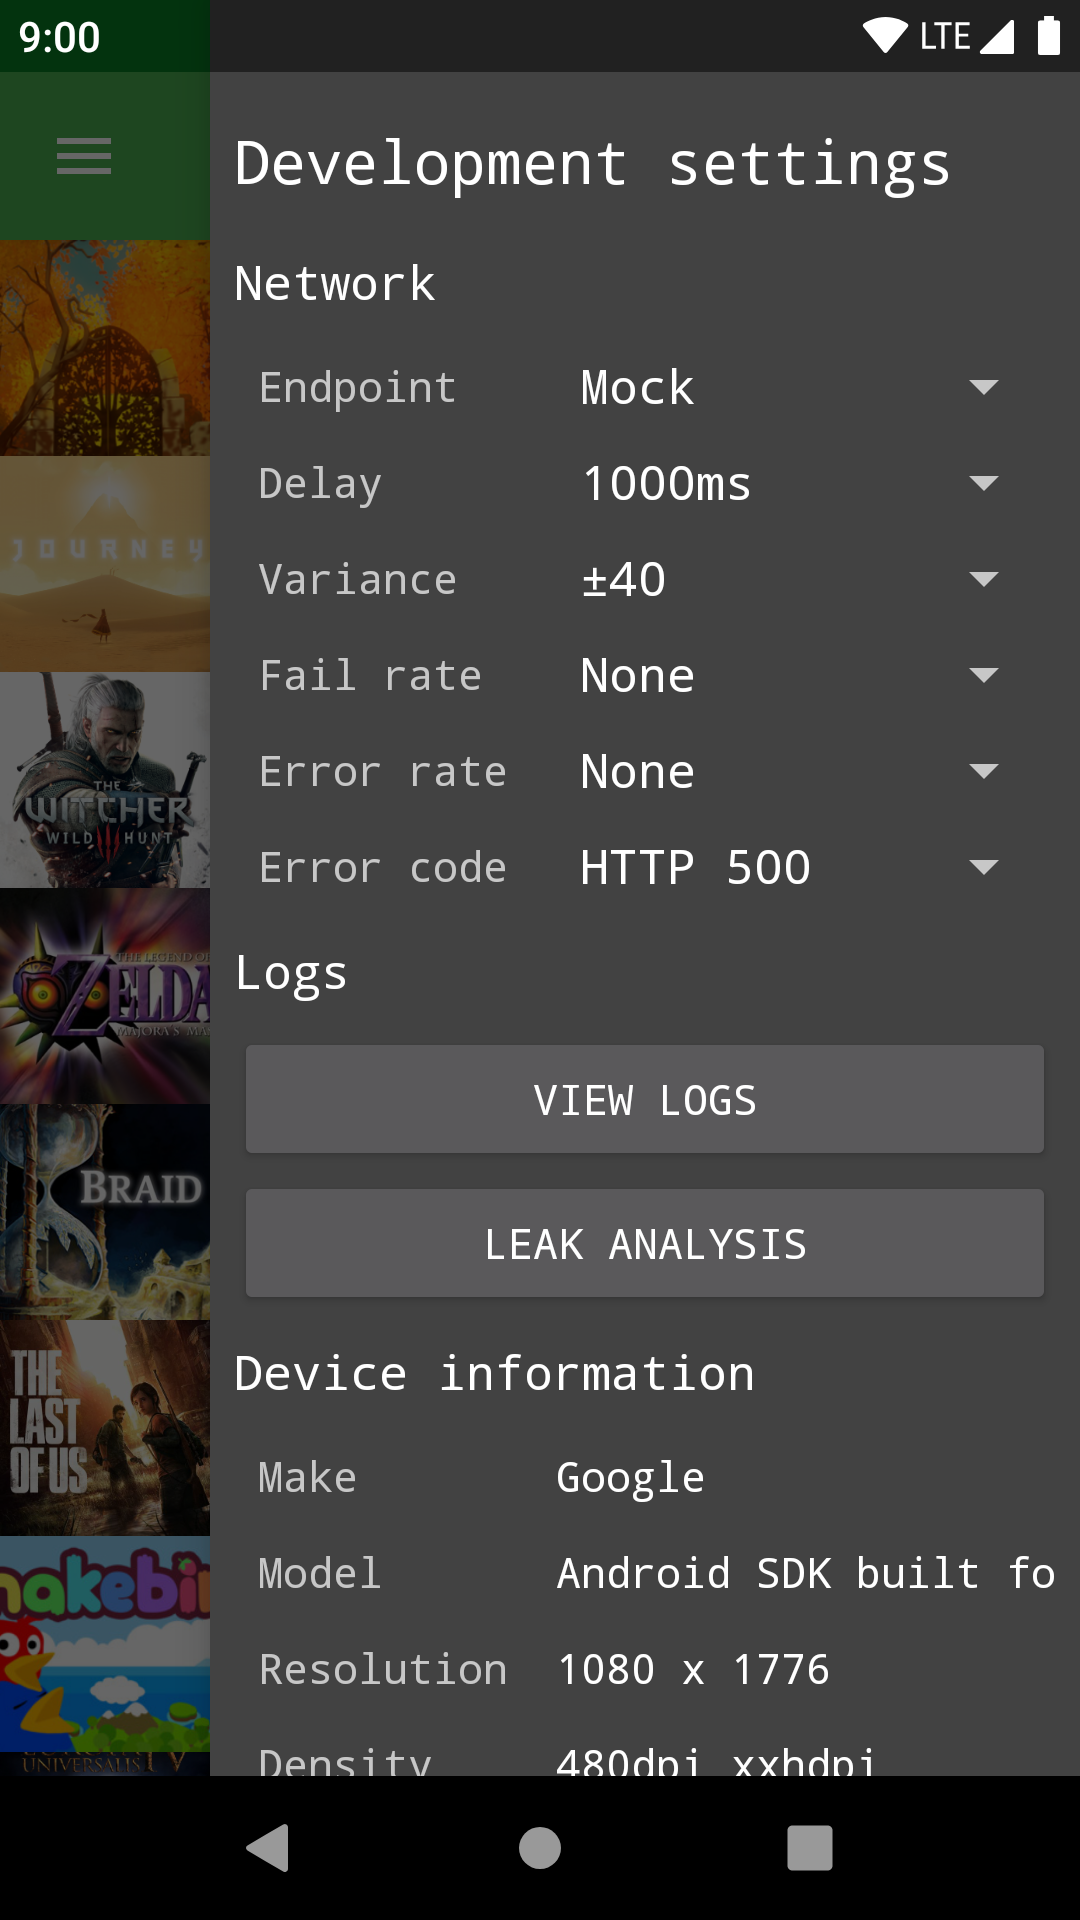
The debug drawer is something you can add to your debug builds to make your life easier as a developer or tester. It provides a convenient way of exposing development specific controls without cluttering up your user interface. There are quite a few possibilities this opens up, such as adding shortcuts, displaying diagnostic information, or anything you might want.
To give you some inspiration, this repository provides out of the box modules for:
- Configuring Retrofit endpoints and mock network behaviour
- Displaying device information
- Viewing and sharing Logcat entries collected by Timber
- Providing a more convenient entry into LeakCanary
- Selecting a logging level and piping OkHttp logs into Timber
Of course, you're free to implement your own modules as well.
Usage
This library assumes that for a given Activity you will populate one to many ViewGroups inside
of it over its lifetime. Instead of calling setContentView() directly, define a function in both
your debug and release builds to get the root ViewGroup that Activity should use to present a
screen. This would look something like...
Debug
Release
You can then use this ViewGroup to populate your Activity's view, or use it as the container
when push/popping Fragments or Controllers or whatever you fancy. For your debug builds this
container will be inside of a
DrawerLayout,
allowing you to swipe from the "end" edge of your screen to get access to debug settings. For
release builds you'll be pushing views into the root container as normal.
Making new modules
You have two options if you want to add custom modules to your drawer. You can implement
DebugDrawerModule,
or you can extend
KeyValueDebugDrawerModule.
The latter is useful if all you want to do is display some key value pairs. The former allows you to
return whatever View you want. It also provides optional lifecycle callbacks if your module needs
to bind and unbind to expensive resources.
The debugdrawer dependency has a few publicly exported style resources. You can use these styles
(such as Widget.DebugDrawer.RowTitle) to ensure your custom module maintains a consistent
appearance with other modules in the drawer. Yes, this is a development tool, but developers can
appreciate nice UIs too!
Why another implementation?
It's true; there are a few other implementations of a reusable debug drawer out there. This project
aims to have a simpler API, especially when it comes to creating custom modules. Also having the
library written in Kotlin makes it more enjoyable to work on ?.
Sample apps
This repository provides two sample apps that demonstrate usage of the debug drawer. The
simple-sample-app has no other dependencies and is about as bare-bones as you can get. The
sample-app is a bit more complex. It interfaces with the
Giant Bomb API to retrieve and display a list of video games, and
aims to be closer to a real application.
Browsing through the implementation of sample-app should provide you with an idea of how you could
add the debug drawer to your app. You might want to use dependency injection to assist in setting it
up, or you could follow the example and try and roll something by hand. Whatever your choice, it
doesn't need to be particularly complex.
Provided modules
LeakCanary
LeakCanary is a fantastic tool for detecting memory leaks in your app. The only problem with it is
how it adds a launcher icon for each app you have installed that uses it. This module takes care of
removing that launcher icon and cages LeakCanary in the debug drawer.
The only requirement for using this module is that you're calling
in your Application class as per LeakCanary's documentation.
Timber
Timber provides some nice utility on top of Android's standard Log class. This modules aims to
enhance it further by providing a mechanism to view logs from within your own app. In addition, it
allows you to share the current collection of logs if you happen to see something interesting.
To use this module you must call
inside of your Application class. Because it would be annoying to define two separate
Application classes for both debug and release builds, a debugdrawer-timber-no-op dependency is
provided. This allows you to keep the LumberYard.install(this) call in your Application for
release builds.
OkHttp logger
It can be incredibly useful to view HTTP requests and results when debugging your app. This module
provides a dropdown menu in the drawer to select what level of logging you'd like to see for your
HTTP requests. It relies on you using OkHttp as your HTTP client, and pipes its output into Timber.
To use it, first add
HttpLogger.interceptor
as an interceptor to your OkHttpClient. Then pass HttpLogger on to
OkHttpLoggerModule.
Device info
Nothing too fancy, this module displays
- Manufacturer
- Model
- Screen resolution
- Screen density
- Current API version
Retrofit
This is one of the more complicated modules. Retrofit is a great tool for abstracting RESTful APIs,
and often you might want to configure its behaviour. This is useful if you make use of
retrofit-mock and want to modify
NetworkBehavior at runtime, or maybe your debug app can target one of many different environments,
such as development, staging, or production.
To begin, you must create a list of
Endpoints.
This list might include entries such as staging, or mock.
Next, create an instance of
DebugRetrofitConfig.
This class takes care of persisting settings between app launches, and forwarding any runtime
modifications to NetworkBehavior. It also ensures that when you select a new Endpoint your
entire app process is restarted.
Finally, you can add
RetrofitModule
to your debug drawer builder and it will take care of the rest. It might be easier to understand by
looking at an example, so check out sample-app to see it in action.
Download
All artifacts are up on jcenter.
For the main library
au.com.gridstone.debugdrawer:debugdrawer:0.9.1
For the LeakCanary module
au.com.gridstone.debugdrawer:debugdrawer-leakcanary:0.9.1
For the Retrofit module
au.com.gridstone.debugdrawer:debugdrawer-retrofit:0.9.1
For the Timber module
au.com.gridstone.debugdrawer:debugdrawer-timber:0.9.1
For the no-op Timber module
au.com.gridstone.debugdrawer:debugdrawer-timber-no-op:0.9.1
For the OkHttp logger
au.com.gridstone.debugdrawer:debugdrawer-okhttp-logger:0.9.1