android-compose-charts
This is an open source library used to draw charts in Android with Jetpack Compose with a simple and easy to use. Just couples of lines.
Usage:
-
Add this line to your project
gradlefile:maven { url 'https://jitpack.io' } -
Add this dependency to your app
gradlefile:implementation 'com.github.MahmoudIbrahim3:android-compose-charts:1.0.0'
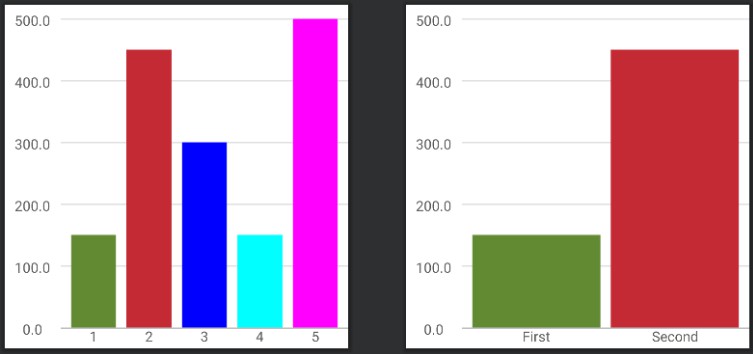
1. Bar Chart:
val barChartData = listOf(
  BarChartEntity(150.0f, Color(0xFF618A32), "1"),
  BarChartEntity(450.0f, Color(0xFFC32A33), "2"),
  BarChartEntity(300.0f, Color.Blue, "3"),
  BarChartEntity(150.0f, Color.Cyan, "4"),
  BarChartEntity(500.0f, Color.Magenta, "5")
)

val verticalAxisValues = listOf(0.0f, 100.0f, 200.0f, 300.0f, 400.0f, 500.0f)

BarChart(
    barChartData = barChartData,
    verticalAxisValues = verticalAxisValues
)
The following code snippet demonstrates a lot of attributes to custom and design your Bar Chart as you like:
BarChart(
  barChartData = barChartData,
  verticalAxisValues = verticalAxisValues,
  axisColor = Color.Red,
  verticalAxisLabelColor = Color.Blue,
  verticalAxisLabelFontSize = 20.sp,
  horizontalAxisLabelColor = Color.Magenta,
  horizontalAxisLabelFontSize = 24.sp,
  paddingBetweenBars = 16.dp,
  isShowVerticalAxis = true,
  isShowHorizontalLines = false,
)
Bar Chart Samples: