ComposeCharter
A library that contains several customizable Charts that can be used in Jecpack Compose’s @Composables.
Basic Usage
1. Add it in your root build.gradle at the end of repositories:
allprojects {
    repositories {
    ...
    maven { url 'https://jitpack.io' }
    }
}
2. Add the dependency to your module:
dependencies {
    implementation 'com.github.nikachapo:ComposeCharter:1.0.1'
}
3. Use Chart Composables:
There is one data class that can be used for drawing Charts:
data class ChartModel(val value: Float, val color: Color, val text: String? = null)
Note: for Animations, library does not have inner implementations, you can use common Animation approach as you would do for composables, for example:
    var cyanPercentage by remember { mutableStateOf<Float?>(0f) }
    var greenPercentage by remember { mutableStateOf<Float?>(0f) }
    var yellowPercentage by remember { mutableStateOf<Float?>(0f) }

    val cyanAnimatedPercentageState = animateFloatAsState(
        targetValue = cyanPercentage ?: 0f,
        animationSpec = tween(1000)
    )

    val greenAnimatedPercentageState = animateFloatAsState(
        targetValue = greenPercentage ?: 0f,
        animationSpec = tween(1000)
    )

    val yellowAnimatedPercentageState = animateFloatAsState(
        targetValue = yellowPercentage ?: 0f,
        animationSpec = tween(1000)
    )
PieChart
PieChart(
    chartModels = listOf(
                ChartModel(cyanAnimatedPercentageState.value, Color.Cyan),
                ChartModel(greenAnimatedPercentageState.value, Color.Green),
                ChartModel(yellowAnimatedPercentageState.value, Color.Yellow)),
    chartSize = 150.dp,
    elevation = 30.dp,
    showCenterDot = true
)
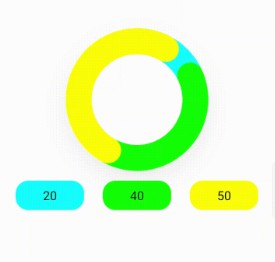
DonutChart
DonutChart(
    chartModels = chartModels,
    chartSize = 150.dp,
    strokeWidth = 100f,
    elevation = 30.dp,
    cap = StrokeCap.Round
)
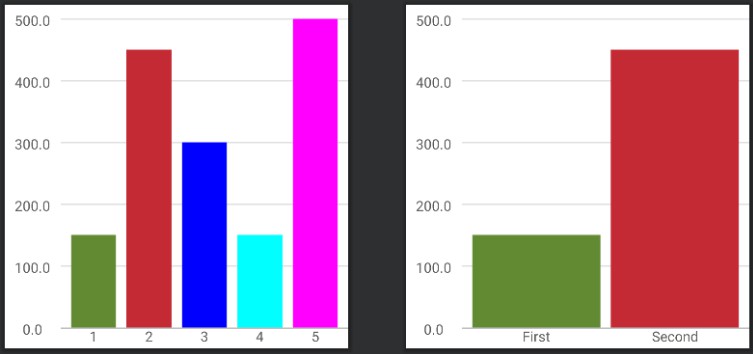
ColumnChart
ColumnChart(
    chartModels = chartModels,
    modifier = Modifier.fillMaxWidth(),
    height = 150.dp,
    columnWidth = 150f,
    spaceWidth = 40f,
    cornerRadius = CornerRadius(12f, 12f),
    showValues = true
)
BarChart
BarChart(
chartModels = chartModels,
modifier = Modifier
          .fillMaxWidth()
          .padding(24.dp),
height = 200.dp
)
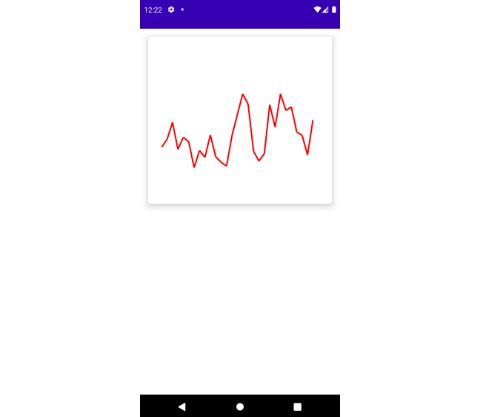
LineChart
LineChart(
    yAxisValues = listOf(10f, 20f, 15f),
    modifier = Modifier
               .fillMaxWidth()
               .height(200.dp)
               .padding(24.dp),
    lineWidth = 2f,
    shouldAnimate = true,
    shouldDrawDots = true,
    lineColors = listOf(
                 MaterialTheme.colors.primary,
                 Color.Green
                 )
)
AreaChart
AreaChart(
    yAxisValues = listOf(10f, 20f, 15f),
    modifier = Modifier
               .fillMaxWidth()
                .height(200.dp),
    spacing = 50f,
    lineWidth = 2f,
    fillColor = Color.Green,
    graphColor = MaterialTheme.colors.primary
)