Statistics View IntelliJ Plugin
StatisticsView IntelliJ plugin enables logging IDE code browsing activities and shows aggregated statistical information (e.g. accumulated file opened times) in the IDE Project view.
The plugin aims to provide some helpful insight into IDE users’ productivity. You can also do some data mining & visualizations base on the raw event logs.
More information can be found on GitHub.
Usage
StatisticsView can be installed via
Settings | Plugins. See the detailed instructions from JetBrains guide.
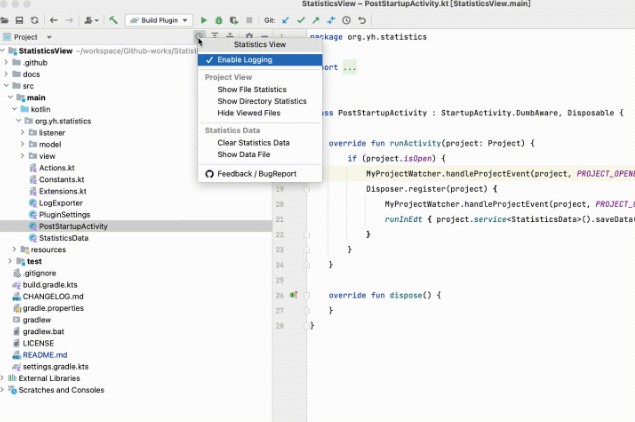
The plugin registers a title bar button in the Project tool window, which provides the following menu options:
- Enable Logging: activate/deactivate logging for the current IDE project. The title bar button is displayed in the toggled state when activated, thus users could have fewer worries about unexpected background logging behaviors.
- Project View:
- Show File Statistics: show/hide aggregated statistical information of each file, e.g. “Last viewed” summary information and accumulated file viewed duration. When IDE frame is deactivated, the duration time is not accounted for.
- Show Directory Statistics: show the percentage of viewed files in each directory.
- Hide Viewed Files: hide viewed files from the Project view. Empty middle directories are also hidden.
- Statistics Data:
- Clear Statistics Data: clear old raw events and pre-aggregated results for the current project. Note that it doesn’t turn off logging simultaneously. Be careful that this operation is unrecoverable.
- Show Data File: locate the current project’s event log file in Finder/Explorer.
How it works
This plugin is highly inspired by activity-tracker as well as some components of the intellij-community project. Apart from recording events, StatisticsView tries to provide some real-time analytical features integrated with the IDE, e.g. adding additional info in the Project view.
Event
StatisticsView subscribes to listeners provided by the IntelliJ Platform for various IDE events, such as file opened, code completion, jump to definition, etc.
For current version (1.0.0) StatisticsView only handles file opened/closed & IDE activated/deactivated events.
Whenever an event is received, StatisticsView records the event type, timestamp, and fileUri (only if the event is file related). StatisticsView won’t process events for files that are not valid source files (e.g. binary files, library folders, intentionally “marked as excluded” directories would be ignored).
Data Storage
StatisticsView saves events directly to a disk file to ensure minimal dependency. This brings some limitations, such as it could be impossible to make complex queries on the file-based datasets, e.g. filter by time range, group by directory, downsampling, etc. Since we need to show summarized information in real-time in the IDE Project view, the query could only be performed against some pre-aggregated data structure in memory.
The write load is relatively low (10+ writes per second at most after debounced / dedup) and events could be safely queued on a file writer and saved to disk periodically in the background thread (EDT) which would not impact IDE performance.
This pre-aggregated hashMap + async file writer practice couldn’t handle back-filling situations: e.g. when the user performs a file renamed action in IDE, events with the previous fileUri should be updated.
So if you are accumulating the event logs for a very long period of time, better migrate the raw data into some external data storage (e.g. TSDB) and perform your data analysis offline.
Data format
For the current version (1.0.0), each event is serialized into JSON string format, which could change in future versions.
JSON serialization is picked by its simplicity (provided by kotlinx.serialization API out-of-box), and it is easier to parse line by line via shell scripts.
Example of log file:
{"ts":1661075776169,"action":"IDE_ACTIVATED","file":"","tags":{}}
{"ts":1661075789662,"action":"FILE_OPENED","file":"/README.md","tags":{"FILE_LINE_OF_CODE":"14"}}
{"ts":1661075798429,"action":"FILE_CLOSED","file":"/README.md","tags":{"FILE_LINE_OF_CODE":"14"}}
{"ts":1661075798429,"action":"FILE_OPENED","file":"/src/main/kotlin/org/yh/statistics/listener/MyFileEditorManagerListener.kt","tags":{"FILE_LINE_OF_CODE":"49"}}
{"ts":1661075799293,"action":"FILE_CLOSED","file":"/src/main/kotlin/org/yh/statistics/listener/MyFileEditorManagerListener.kt","tags":{"FILE_LINE_OF_CODE":"49"}}
{"ts":1661075839459,"action":"FILE_OPENED","file":"/src/main/kotlin/org/yh/statistics/view/MyViewTreeStructureProvider.kt","tags":{"FILE_LINE_OF_CODE":"43"}}
{"ts":1661075841073,"action":"FILE_CLOSED","file":"/src/main/kotlin/org/yh/statistics/view/MyViewTreeStructureProvider.kt","tags":{"FILE_LINE_OF_CODE":"43"}}
{"ts":1661075841073,"action":"FILE_OPENED","file":"/src/main/kotlin/org/yh/statistics/view/MyViewNodeDecorator.kt","tags":{"FILE_LINE_OF_CODE":"71"}}
{"ts":1661075850804,"action":"IDE_DEACTIVATED","file":"","tags":{}}
Data Analysis & IDE Productivity [WIP]
Note: most of this part is not closely related to the duty of the StatisticsView plugin. There are many similarities between IDE code activities and microservices observability concepts.


