An easy-to-use, cross-platform measurement tool that pulls data out of CD pipelines and analysis the four key metrics for you

Maintained by SEA team, ThoughtWorks Inc.
Read this in other languages: English, 简体中文
Table of ContentsAbout the Project
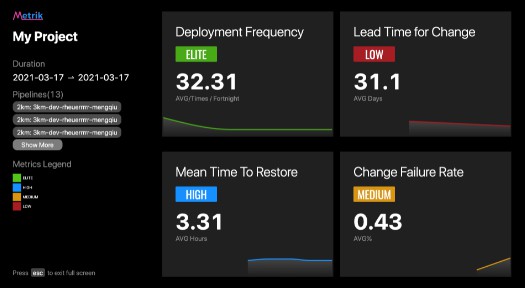
For development teams who wants to measure their software delivery and operational (SDO) performance, this is a tool that helps them collect data from CD pipelines and visualize the key metrics in a friendly format.
The key differentiators:
- One page configuration, quick and easy.
- The ability to work across different CD platforms.
- User can select the environment in which the analysis runs via a environment filter (Yes, production env is not the only one that matters)
Don’t know what are those four key metrics?
Integration roadmap
List of CD tools the product supports now/plan to support
-
Jenkins
-
Bamboo
-
Github Actions
-
CircleCI
…and more on the way
Usage
Follow the two steps below to run the tool, and measure the four key metrics of your projects.
Install and run
The product is released to an ECR Docker repository public.ecr.aws/j2s5d3z8/4-key-metrics. Please follow the steps:
- Ensure Docker has already installed on your OS.
- Find available release versions in the release page.
Or, you can find all history versions from our image repository - Run the container locally via the following command:
docker run -d -p 80:80 --name metrik public.ecr.aws/j2s5d3z8/4-key-metrics:latest
⚠️ We use port 80 to access the app. You may switch to any other port in case port 80 is occupied by other apps running on your machine.
⚠️ The latest tag matches the most recent version of this repository. Thus using public.ecr.aws/j2s5d3z8/4-key-metrics:latest or public.ecr.aws/j2s5d3z8/4-key-metrics will ensure you are running the most up to date version of this image.
If you want to stick to a specific version tag, remember there no “v” in version name. e.g. public.ecr.aws/j2s5d3z8/4-key-metrics:1.1.10
Configure your projects
After the container is running on your machine. Go to your favourite browser and open the app. If running in local that would be http://localhost:80/.
- Start the configuration:
- And the charts for each key metric will be available at the main page:
- Also the full screen view if you want to put it on big screens:
Advanced usage
If you would like to keep the 4-key-metrics data to avoid losing any data when remove container, you
can mount the database folder /data/db out. And logs are also available if you mount the log folder /app/logs. As shown in the example below:
docker run -d -p 80:80 --name metrik -v "/path/to/local/directory:/data/db" -v "/path/to/another/directory:/app/logs" public.ecr.aws/j2s5d3z8/4-key-metrics:${release_version}
How to Compute, FAQs
Contributing
Contributions are what make the open source community such an amazing place to be learn, inspire, and create. Any contributions you make are greatly appreciated.
Please check our contributing guideline form HERE
Getting Started
The codebase comprises of three major components frontend, backend, ci.
-
Frontend app is a web application built with:
- TypeScript
- ReactJS
- ReCharts
Go to frontend folder to find more details.
-
Backend app is built with:
- Kotlin
- Spring Boot Web
- MongoDB
Go to backend folder to find more details.
-
Build/Package scripts lives in ci folder
More
You might also like:
- Buildvis, transparency for your build pipeline’s results and runtime
- HeartBeat, calculates delivery metrics from CI/CD build data, revision control and project planning tools.
- GoCD Analytics Plugin, provides insights into your GoCD instance.
License
Distributed under the MIT License. See LICENSE for more information
Contributors ✨
Thanks goes to these wonderful people (emoji key):
This project follows the all-contributors specification. Contributions of any kind welcome!